NEW! Explore the drop menu for the latest long-range climate imagery from the C3S, ECMWF, UKMET, and NMME.
Select an image category:
Global Heights 2
Global Heights 3
Global Heights 4
Global Heights 5
Global Heights 6
USA Heights 2
USA Heights 3
USA Heights 4
USA Heights 5
USA Heights 6
MME Height Season 1
MME Height Season 2
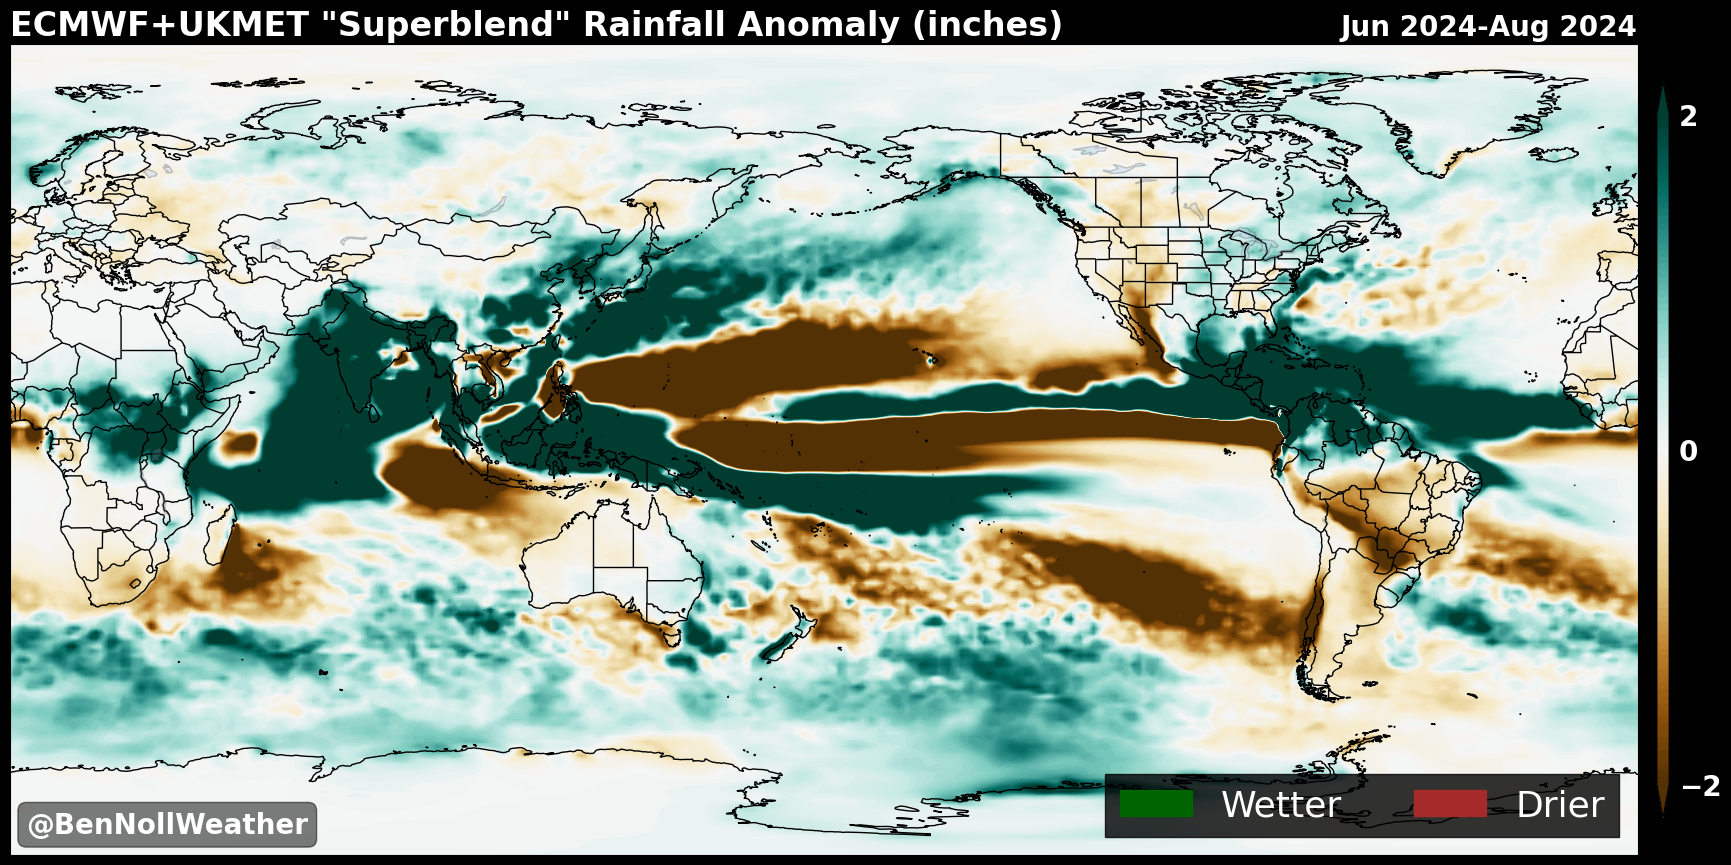
Superblend Precip Globe Season 1
Superblend Precip Globe Season 2
Superblend Precip Atlantic Season 1
Superblend Precip Atlantic Season 2
Superblend Precip USA Season 1
Superblend Precip USA Season 2
Superblend Temperature Globe Season 1
Superblend Temperature Globe Season 2
Superblend Temperature USA Season 1
Superblend Temperature USA Season 2
Superblend Dew Point Globe Season 1
Superblend Dew Point Globe Season 2
Superblend Dew Point USA Season 1
Superblend Dew Point USA Season 2
Superblend Cloud Globe Season 1
Superblend Cloud Globe Season 2
Superblend Cloud USA Season 1
Superblend Cloud USA Season 2
Superblend Wind Globe Season 1
Superblend Wind Globe Season 2
Superblend Wind USA Season 1
Superblend Wind USA Season 2
Superblend OLR Globe Season 1
Superblend OLR Globe Season 2
Superblend OLR USA Season 1
Superblend OLR USA Season 2
SST 2
SST 3
SST 4
SST 5
SST 6
VP 2
VP 3
VP 4
VP 5
VP 6
Jet 2
Jet 3
Jet 4
Jet 5
Jet 6
Zonal 2
Zonal 3
Zonal 4
Zonal 5
Zonal 6
Strat 2
Strat 3
Strat 4
Strat 5
Strat 6
Snow USA 2
Snow USA 3
Snow USA 4
Snow USA 5
Snow USA 6
Snow Globe 2
Snow Globe 3
Snow Globe 4
Snow Globe 5
Snow Globe 6
Niño Heatmap
Niño Strong Heatmap
Niño Very Strong Heatmap
Zonal Heatmap
Niña Heatmap
IOD Positive Heatmap
IOD Negative Heatmap
Gulf Heatmap
Niño 3.4 Chart
Niño 3.4 Table
NMME Precip Globe Season 1
NMME Precip Globe Season 2
NMME Precip Globe Season 3
NMME Precip USA Season 1
NMME Precip USA Season 2
NMME Precip USA Season 3
NMME Precip Atlantic Season 1
NMME Precip Atlantic Season 2
NMME Precip Atlantic Season 3
NMME Temps USA Season 1
NMME Temps USA Season 2
NMME Temps USA Season 3
SST 1
SST 2
SST 3
SST 4
SST 5
SST 6
SST 7
SST 8
SST 9
These graphics are generated by Ben Noll using data from the Copernicus Climate Change Service (C3S). The C3S (ECMWF) imagery updates once a month around the 10th (6th) and provides insights on general climatic patterns for the next six months. Unless otherwise stated, anomalies are computed with respect to the 1993-2016 long-term mean. You are welcome to use the imagery with proper credit.
North American Multi-Model Ensemble (NMME) imagery updates once a month around the 7th.