
A climate change dashboard for the Hudson Valley
I’m pleased to share this climate resource for Hudson Valley educators, farmers, growers, long-term planners, policy-makers, and anyone who is interested in tracking our changing climate.
This project provides some baseline information for our region. The process is largely automated, such that every year I’ll be able to run a script by around January 10th that summarizes the climate over the last year and adds a new point onto the charts that you can explore below.
It’s a much more comprehensive version of this Twitter thread that I wrote in 2021.
The data source is ECMWF-ERA5, which is known as an atmospheric reanalysis. Reanalysis combines model data with observations from across the world into a globally complete and consistent dataset using the laws of physics. It allows us to analyze key climate parameters over a wide area back to 1940, which is the period over which a substantial amount of warming has occurred.
Not only does the data tell us that our atmosphere is getting warmer, but also moister.
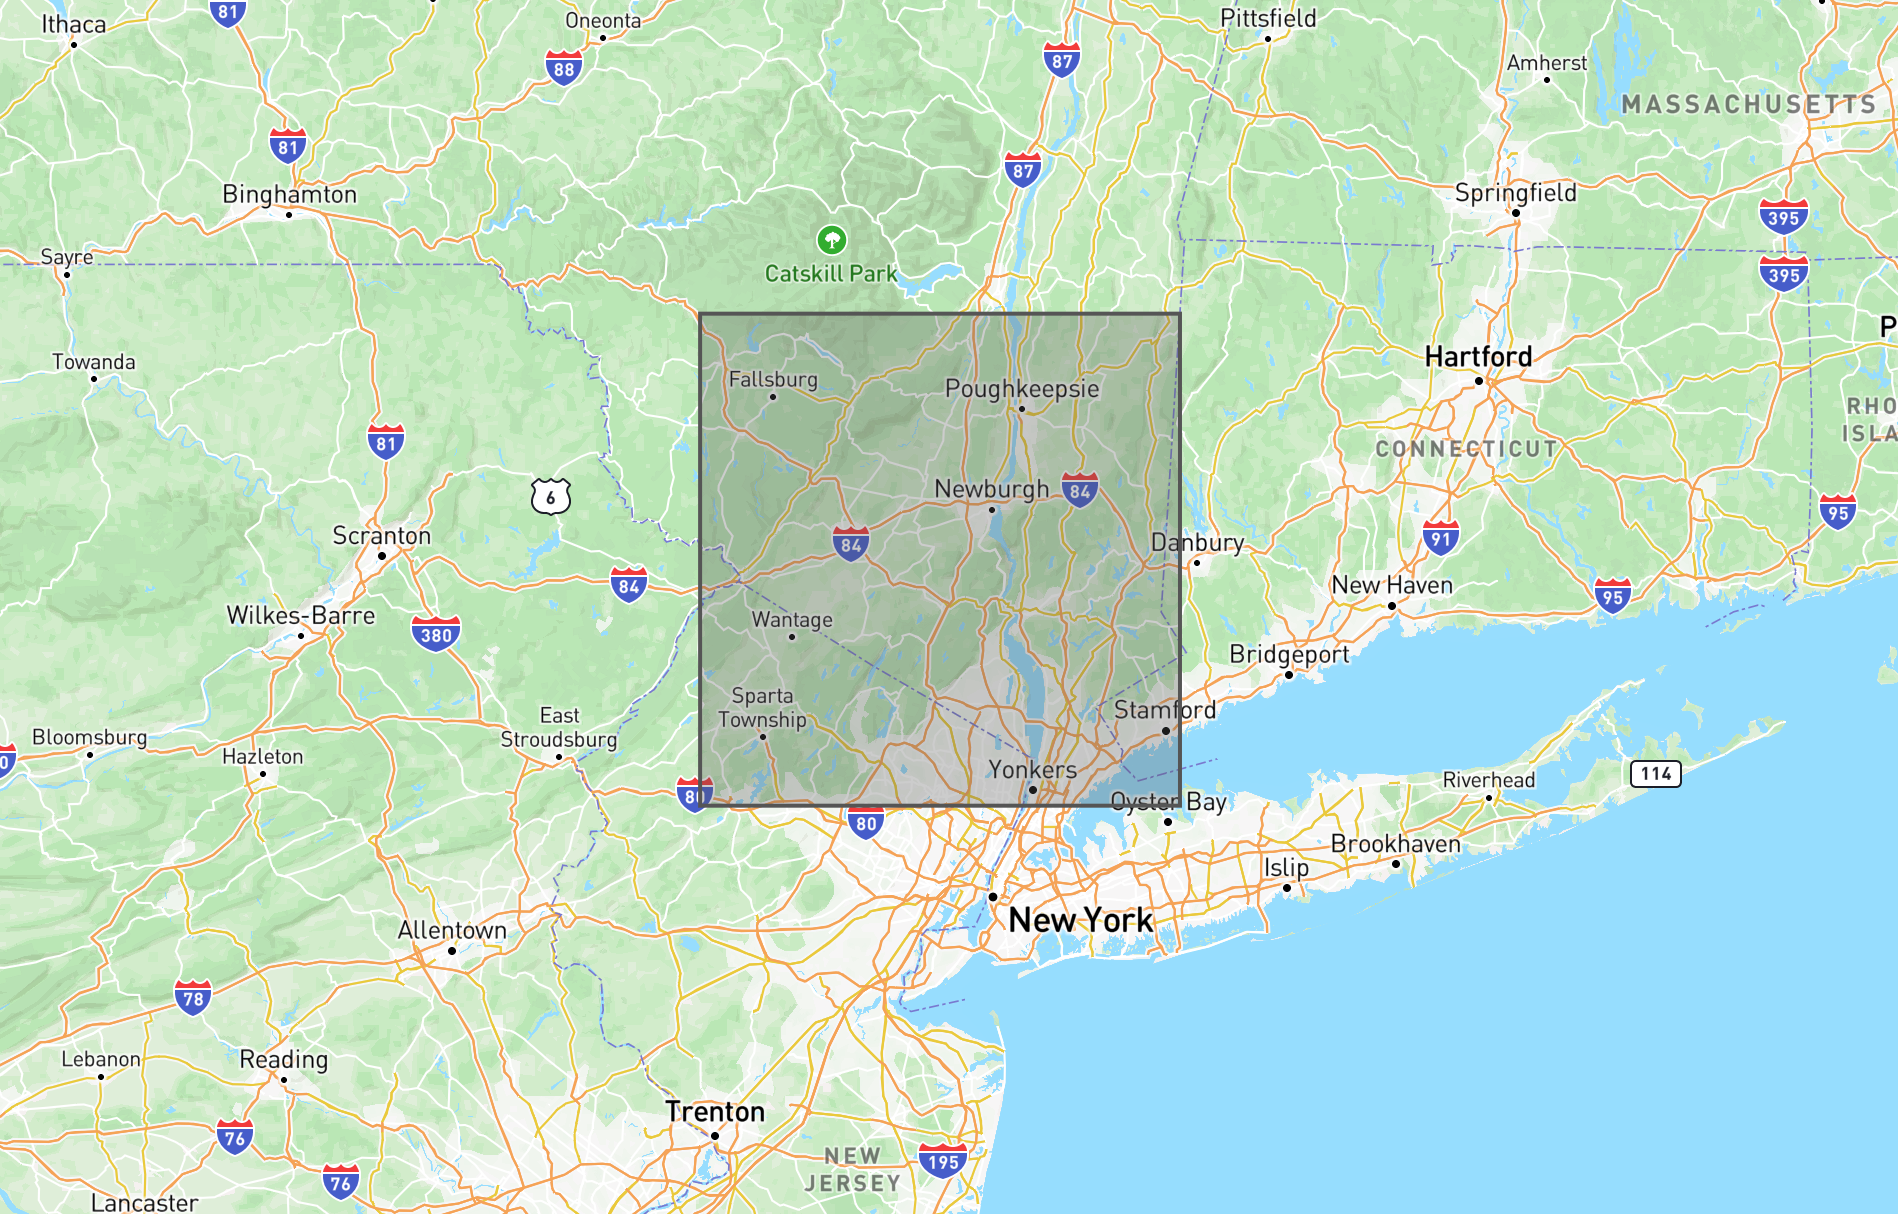
The charts below are based upon average data within a geographical area that contains the mid and lower Hudson Valley. That region is outlined below.
The plots showing the starkest trends are shared first, followed by the weather parameters that haven’t exhibited sustained changes over the last eight decades.
Time to start. First up, temperature.
Annual Average Temperature 📈

The changes in our temperatures have become increasingly noticeable in recent decades. The Hudson Valley has gone from a region that used to have annual average temperatures in the upper 40s to one that is now seeing annual averages exclusively over 50.
This is nudging the temperature distribution to the right. So instead of seeing 20s and snow in January, we’re seeing more 30s and mixed precipitation. In early fall, instead of getting temperatures in the 70s, we’re experiencing more 80s.
Our future? 55-60˚F average annual temperatures. That's more like what Philadelphia or Washington D.C experience currently.
Warming temperatures are the most clear-cut way in which our climate is changing.
I know what you're thinking — warmer temperatures? That sounds nice! While our rising temperatures may not sound catastrophic, it is in other parts of the planet, such as the Arctic, where ice is melting and in tropical areas where heat and humidity is becoming more difficult to bear.
Temperature trends by month

This chart shows the monthly temperature trend in our region — all months have warmed, but December has warmed the most (3.8 degrees), while October has warmed the least (0.6 degrees). February, March, August, and December have all warmed over 2 degrees.
Atmospheric moisture 💧

As air warms, its capacity to hold water increases at the Clausius-Clapeyron rate, about 4% per degree Fahrenheit.
This is linked to the trend shown in the chart above — toward a moister atmosphere.
A warmer atmosphere loads the dice toward heavier rainfall events, but the weather ingredients still need to converge to squeeze moisture out of the clouds. Even though our atmosphere is getting moister, droughts can still happen.
Such a trend can also contribute to higher risks for extreme rainfall rates that can cause flash flooding.
Humidity 🥵

Annual average humidity has been on a steady, upward climb.
I’d expect that the increase in atmospheric moisture, as shown in the previous chart, will also cause an increase in near-ground humidity levels over time. Higher humidity levels in summer would have more of an impact on our lives by influencing a higher incidence of heat stress, increasing the need for cooling.
Rainfall 🌧️

Rainfall remains variable. Recent decades show a slight wetting trend, probably at least partly linked to rising atmospheric moisture.
I find it more interesting to look at how monthly rainfall distribution is changing, such as in the chart below.

Trending wetter: January, March, June, August, September, October, December (bold months indicate the largest change)
Trending drier: February, April, May, July, November
While annual rainfall averages may not be moving a whole lot, seven months are getting wetter and five months are getting drier.
Snowfall ❄️

Snow. At the end of the day, it’s the primary reason why I write about the weather.
Our gradual trend toward lower annual snowfall over the last decade is linked to rising temperatures.
When 32 degrees becomes 34 or 35, it’s simply harder for precipitation to fall as snow.
Still, there is a good deal of variability in our year-to-year snowfall and a warming climate doesn’t preclude very snowy winters on occasion, but it would seem that winters aren’t quite what they used to be.
In short, the coldest winters are behind us and the snowiest ones probably are too 🫤
The Hudson Valley may see little snow by the year 2400 if these trends continue.
Cloud cover ☁️

This chart shows how annual average cloud cover has changed over the decades. There’s a gentle upward slope, probably linked to increasing atmospheric moisture content.
Increased cloud cover can trap heat near the Earth’s surface, hence why monitoring it is important.
Wind strength 🌬️

Annual average wind strength hasn’t changed much over the last 80+ years.
To understand more about trends in wind, other atmospheric levels would need to be examined, such as around the jet stream.
Thunderstorm fuel ⚡

Thunderstorm fuel displays a great deal of year-to-year variability. Driven by prevailing winds, temperatures, and moisture availability, it doesn’t appear that a warming climate is necessarily increasing the chance for thunderstorm activity, although recent warm, moist years have been associated with higher thunderstorm fuel.
Bottom line - our climate is changing
Our climate has always changed, but some variables, like temperature, are changing more rapidly than they have ever before.
Our atmosphere is becoming moister, which loads the dice toward heavier rainfall events and probably more humidity and possibly clouds.
Rainfall is variable, but a slight wetting trend may be occurring.
A trend toward lower annual snowfall is likely linked to rising temperatures.
Thunderstorm fuel and winds have not changed too much over the decades.
Thanks for reading! I hope you found this informative.