
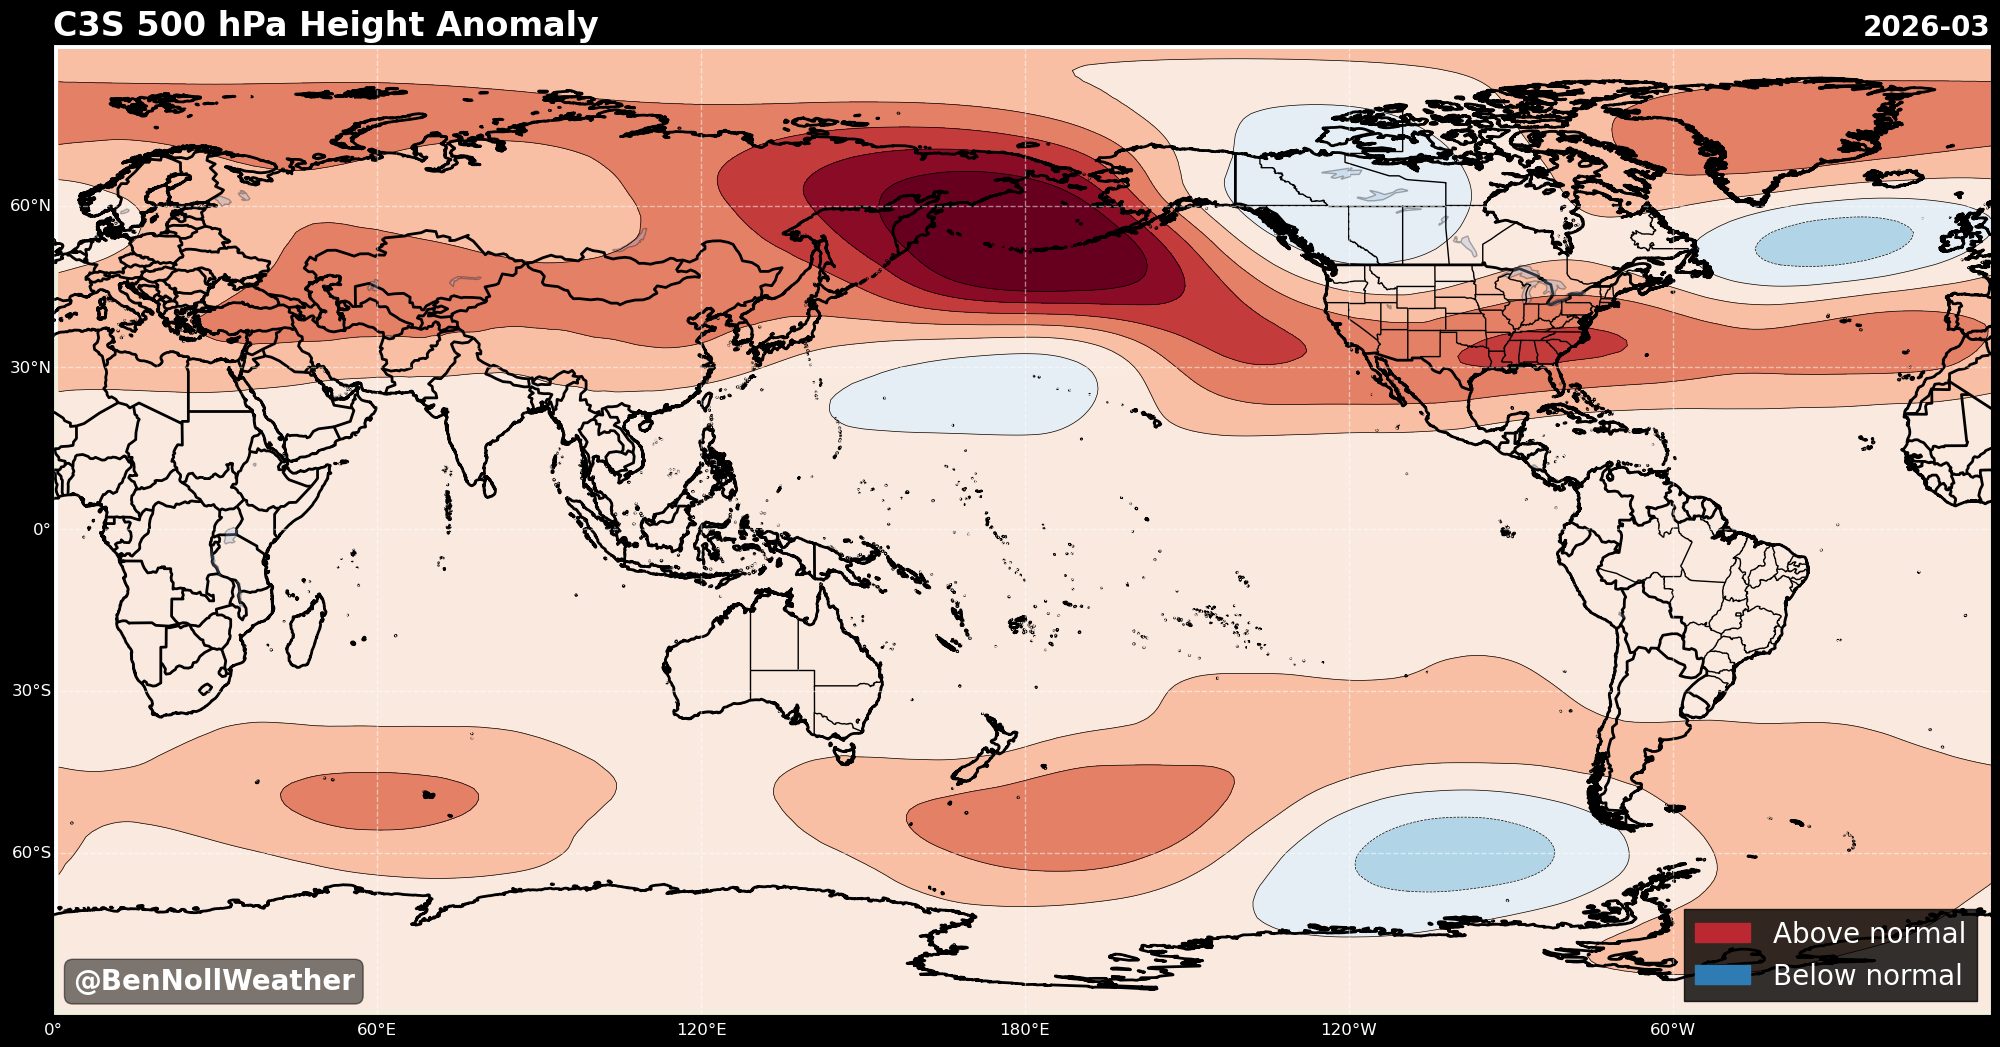
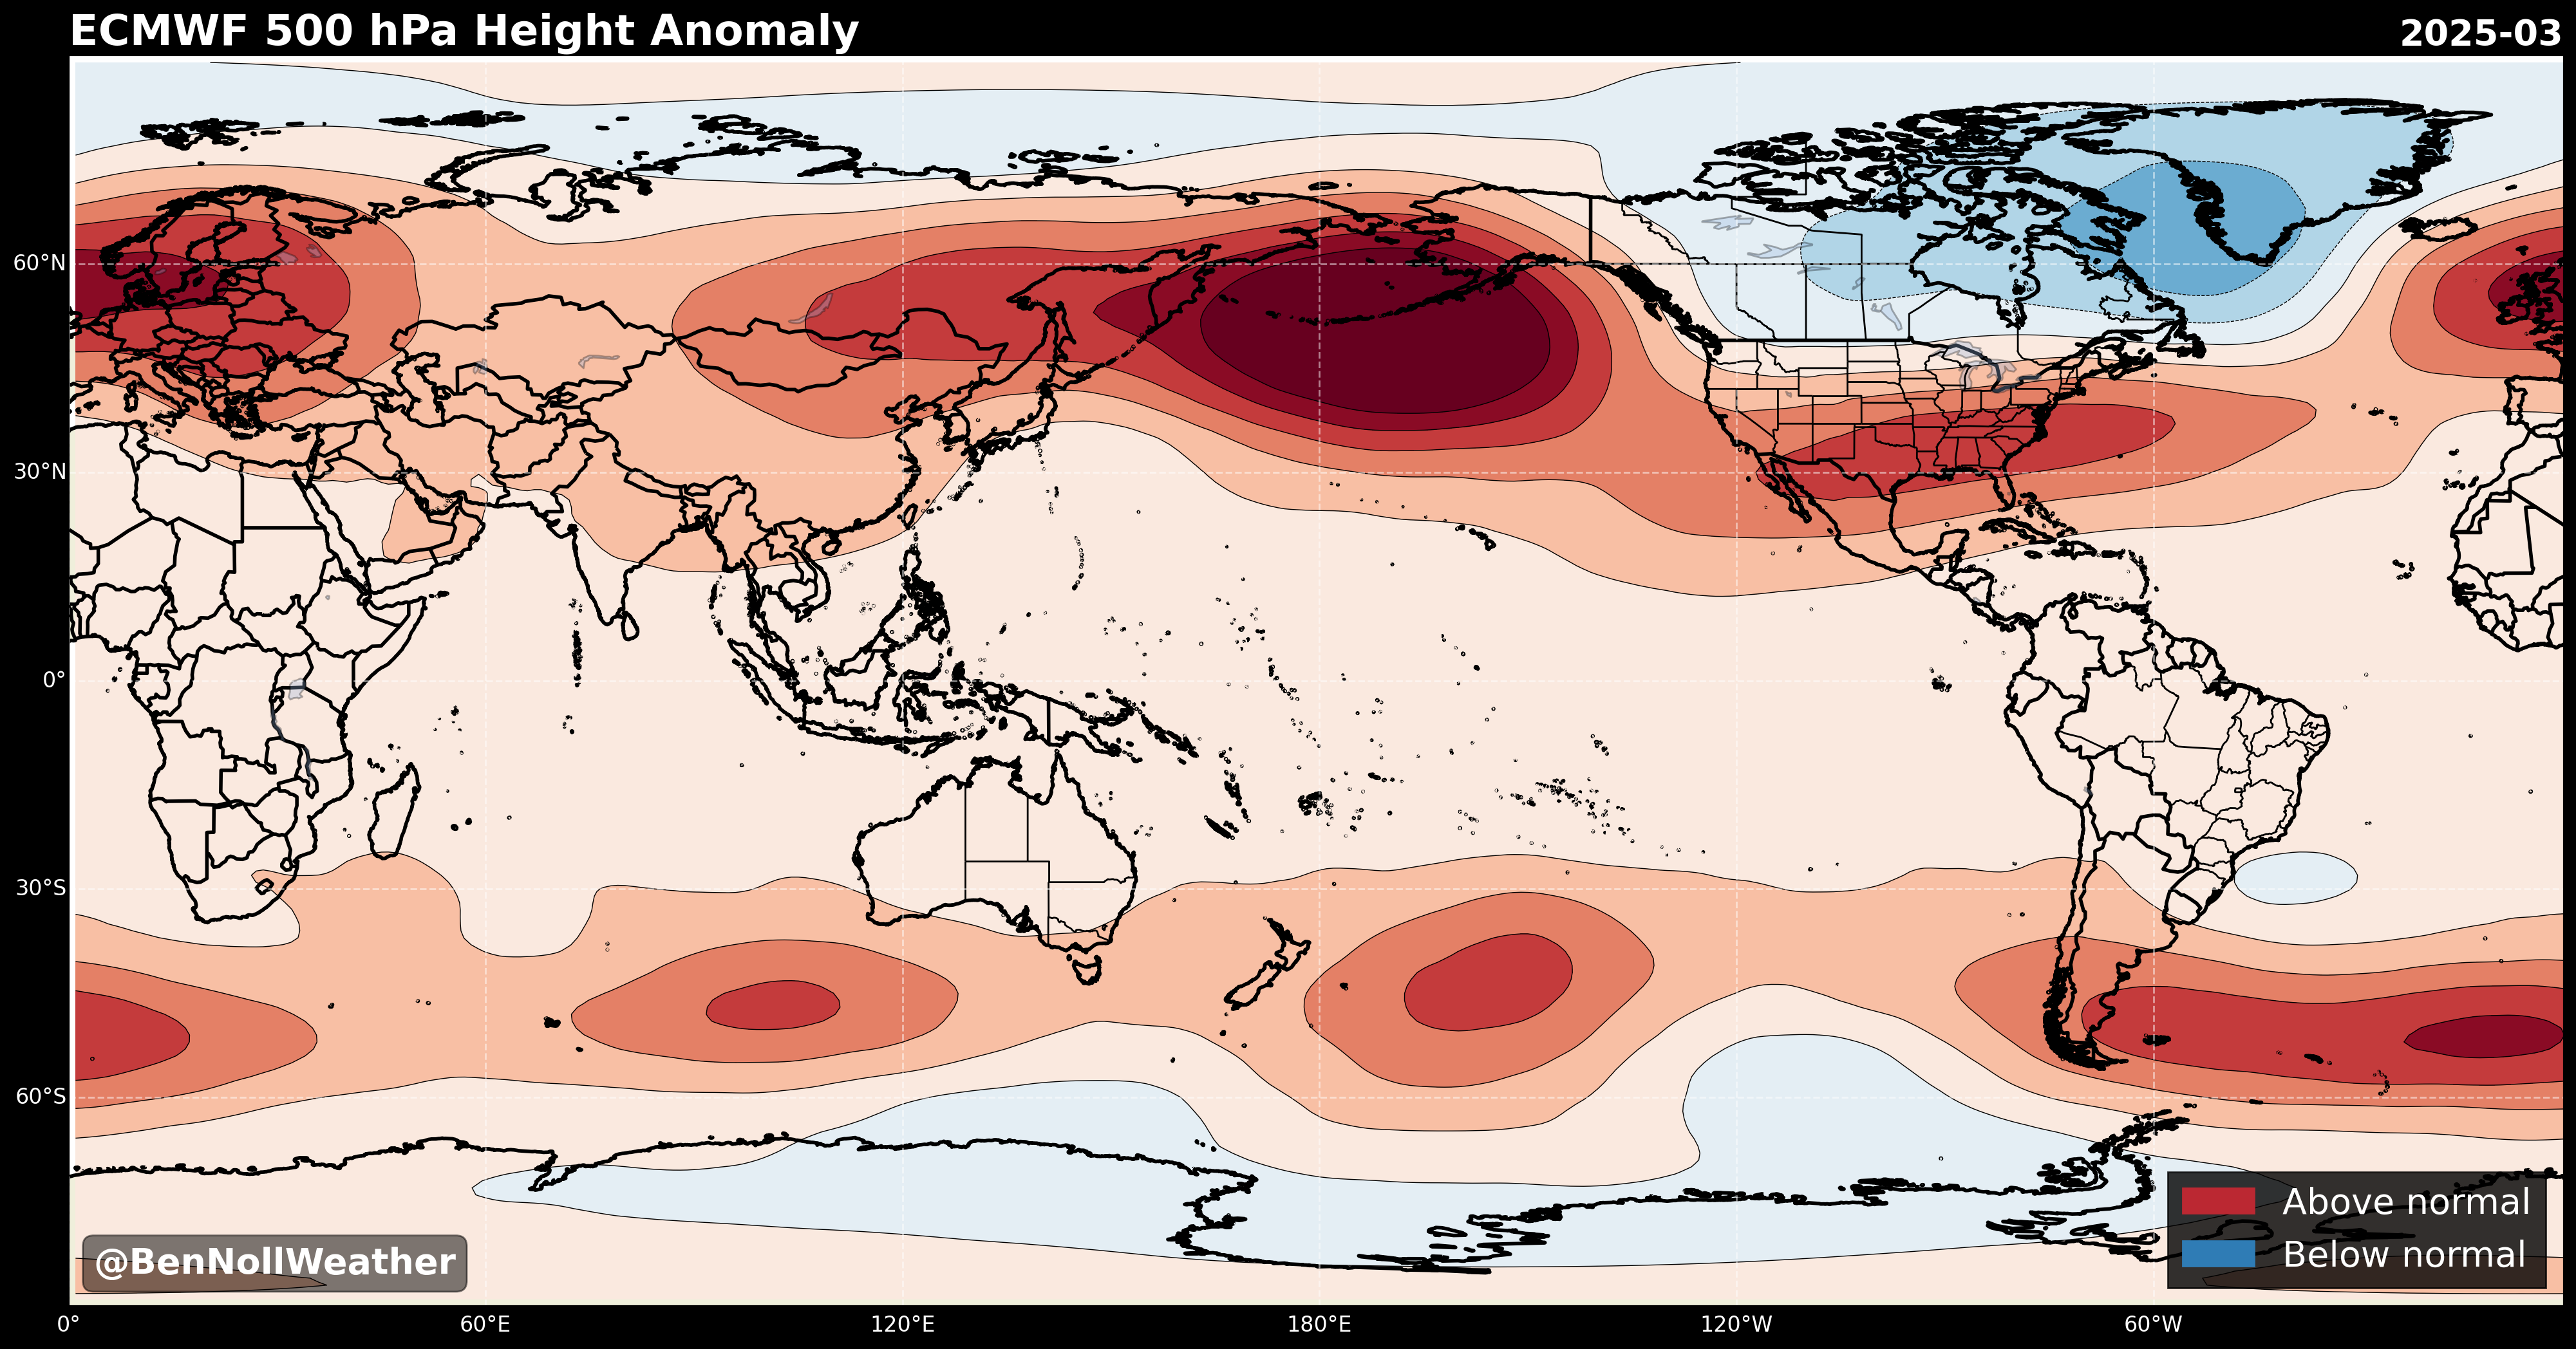
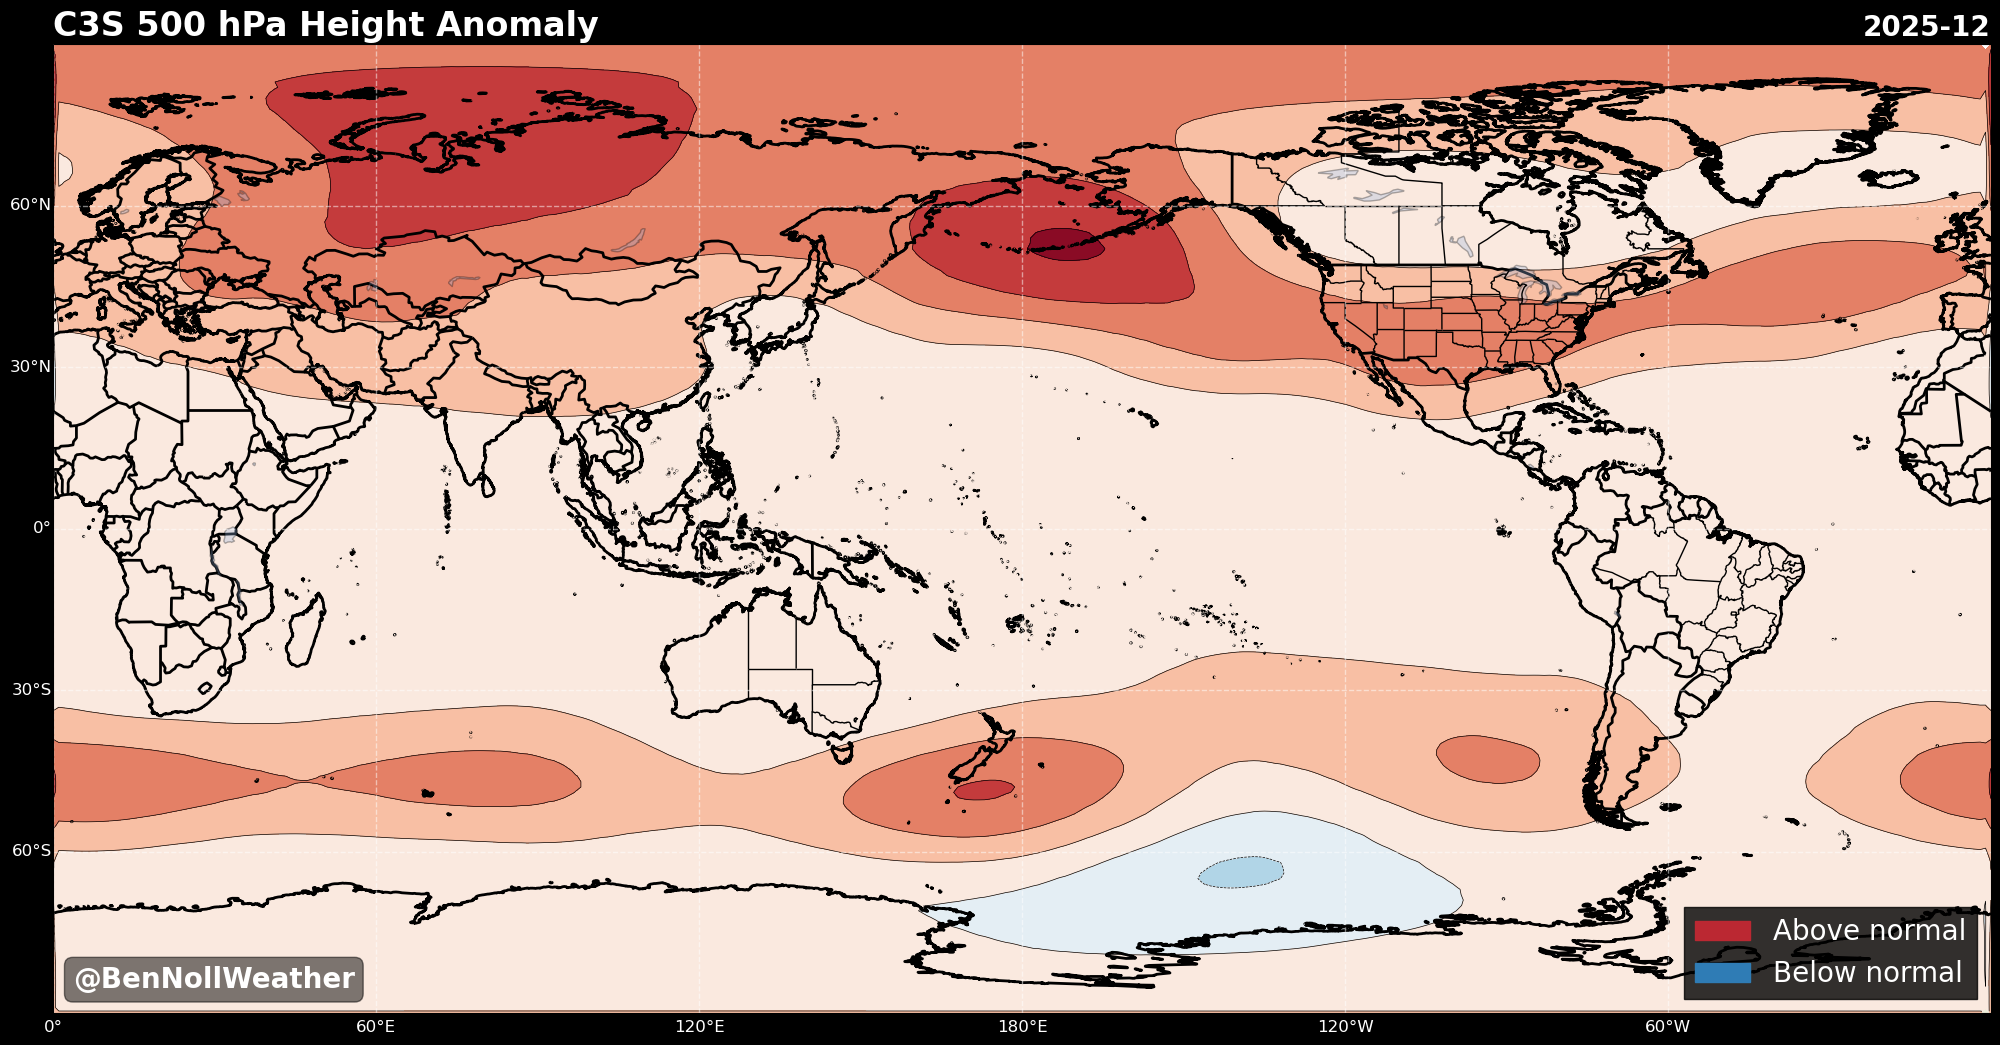
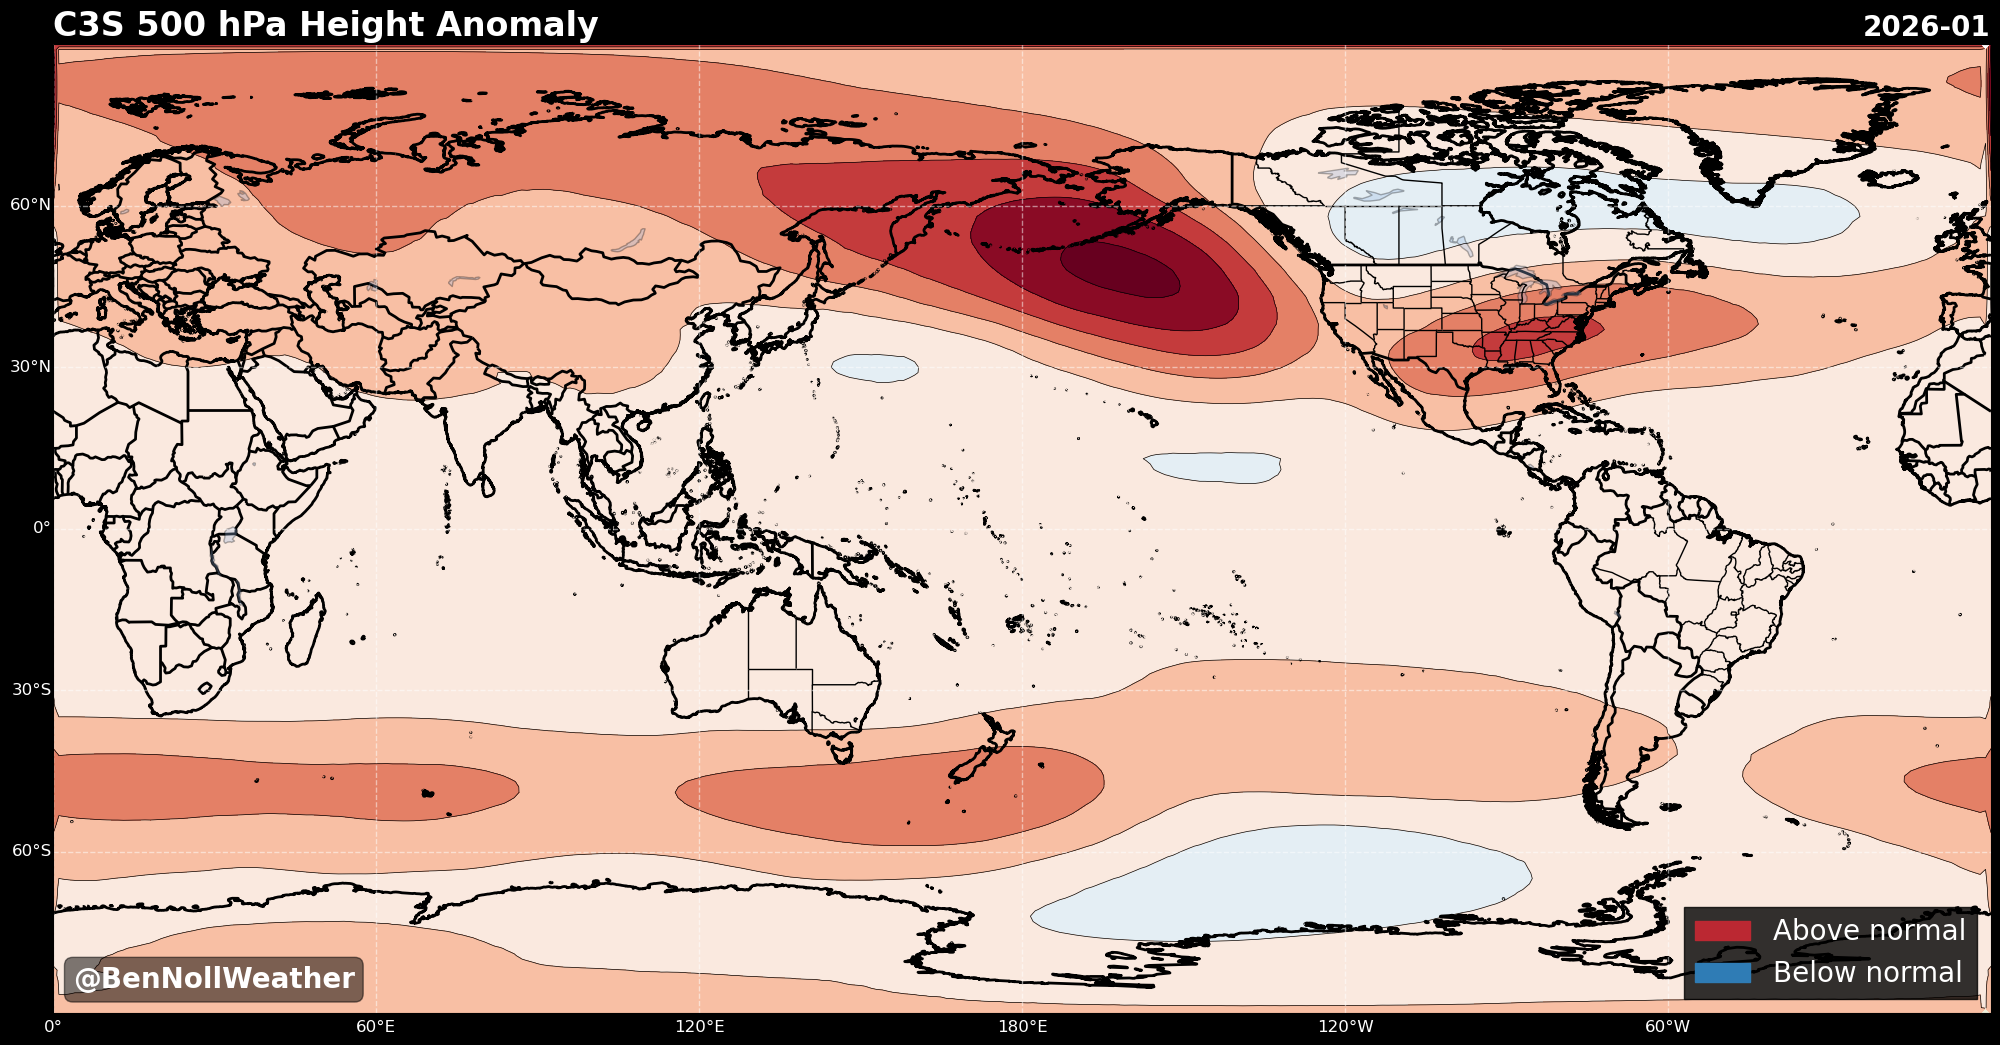
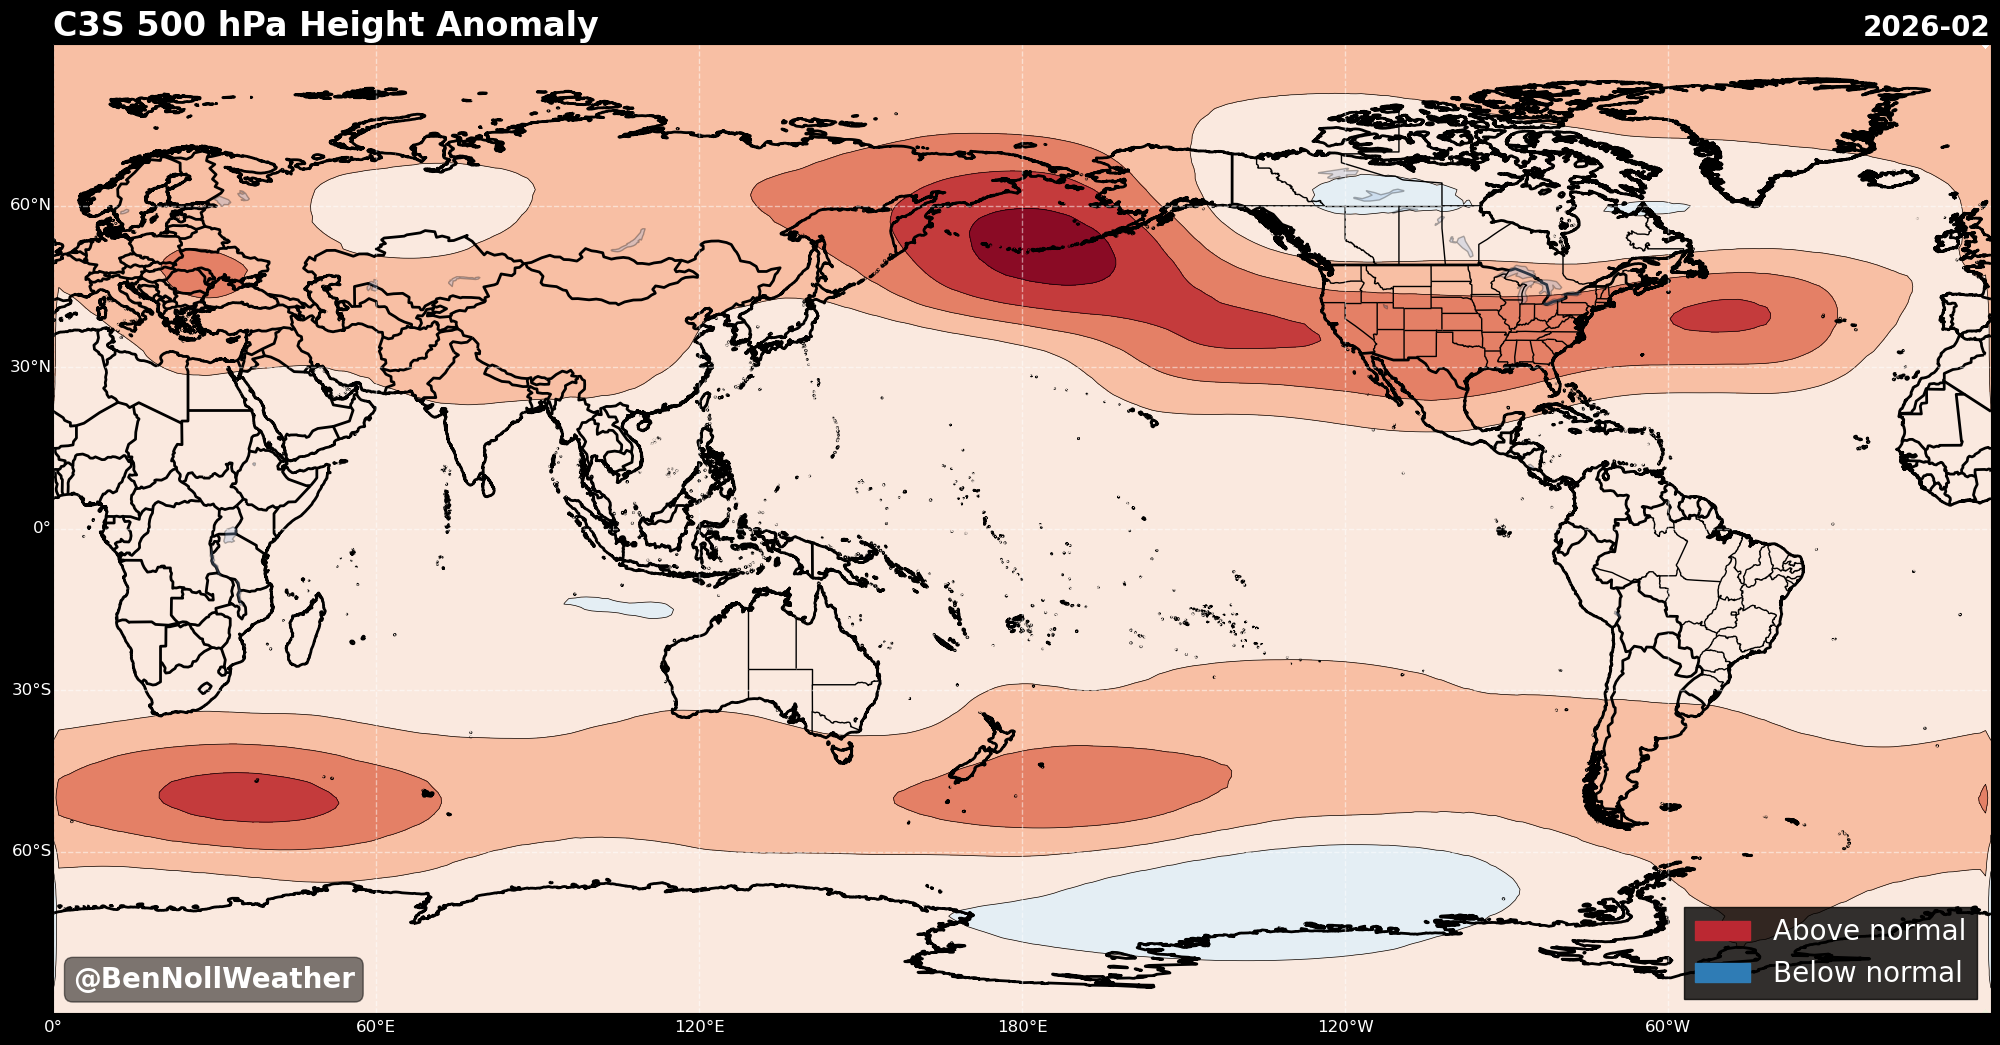
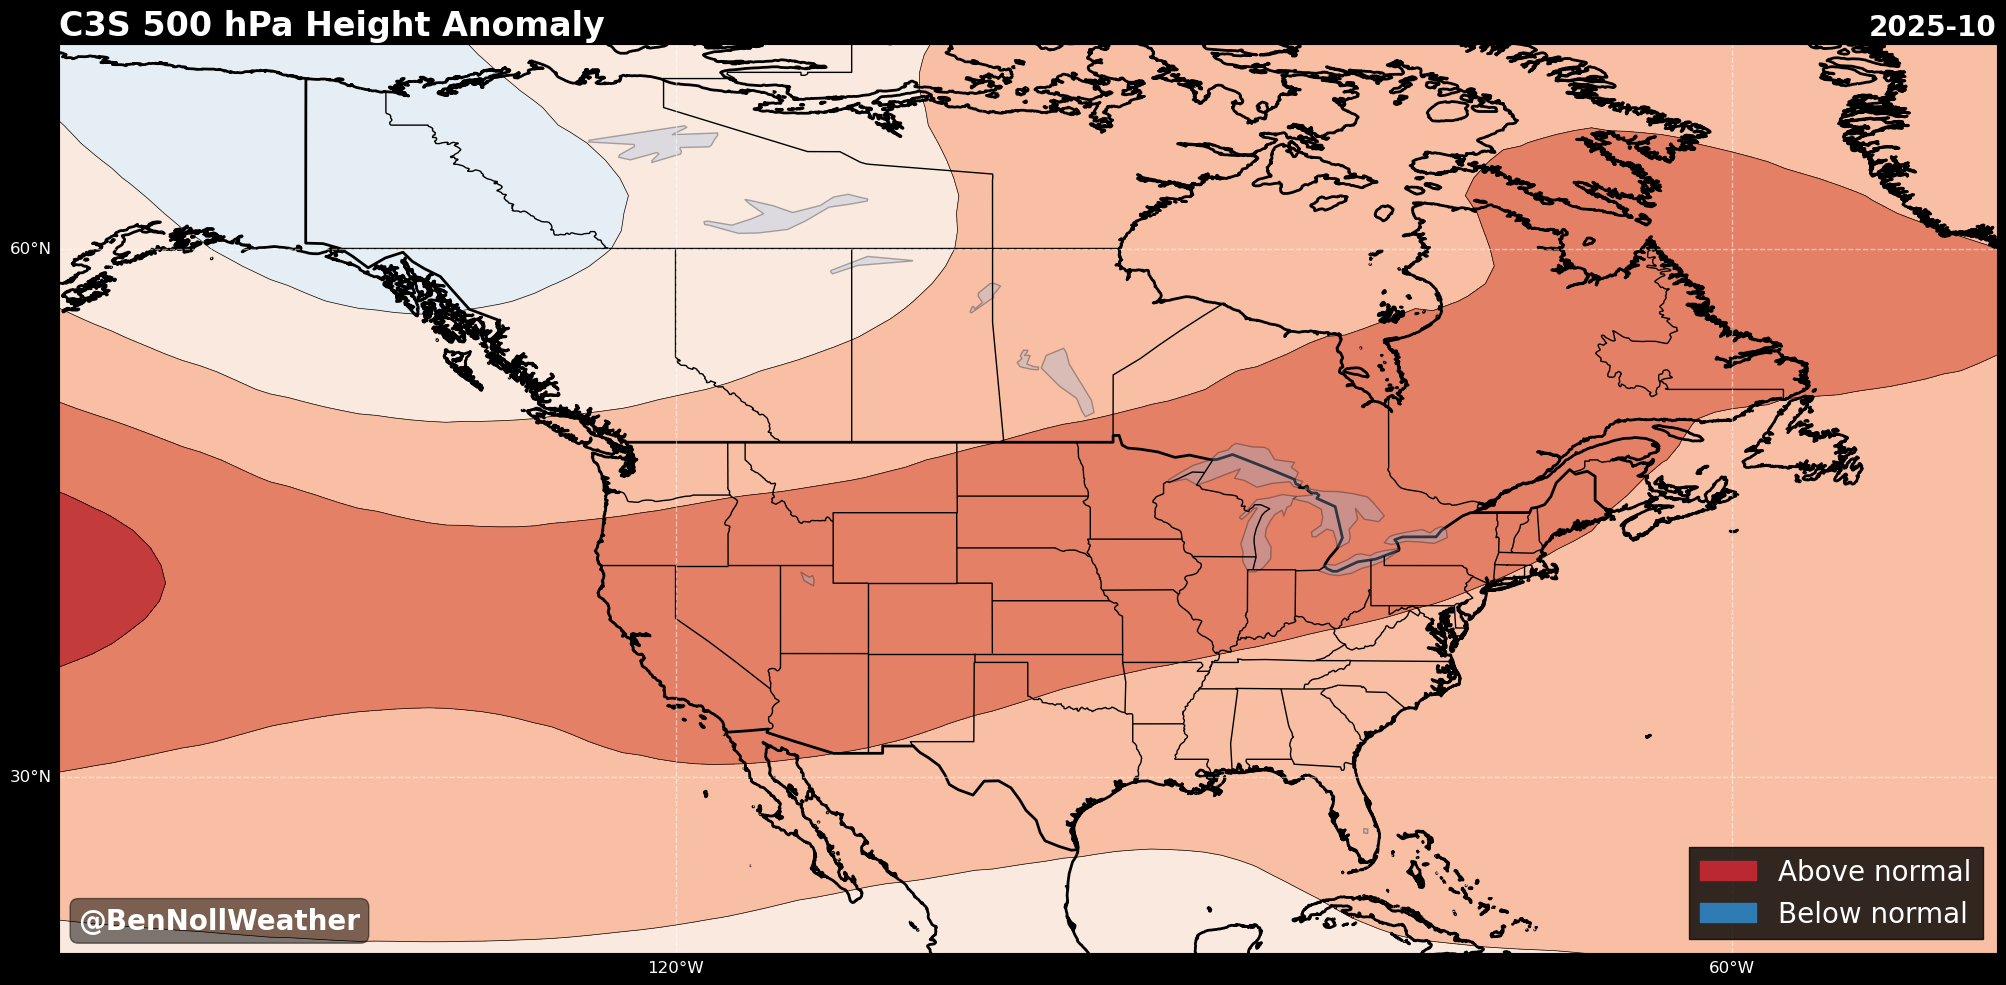
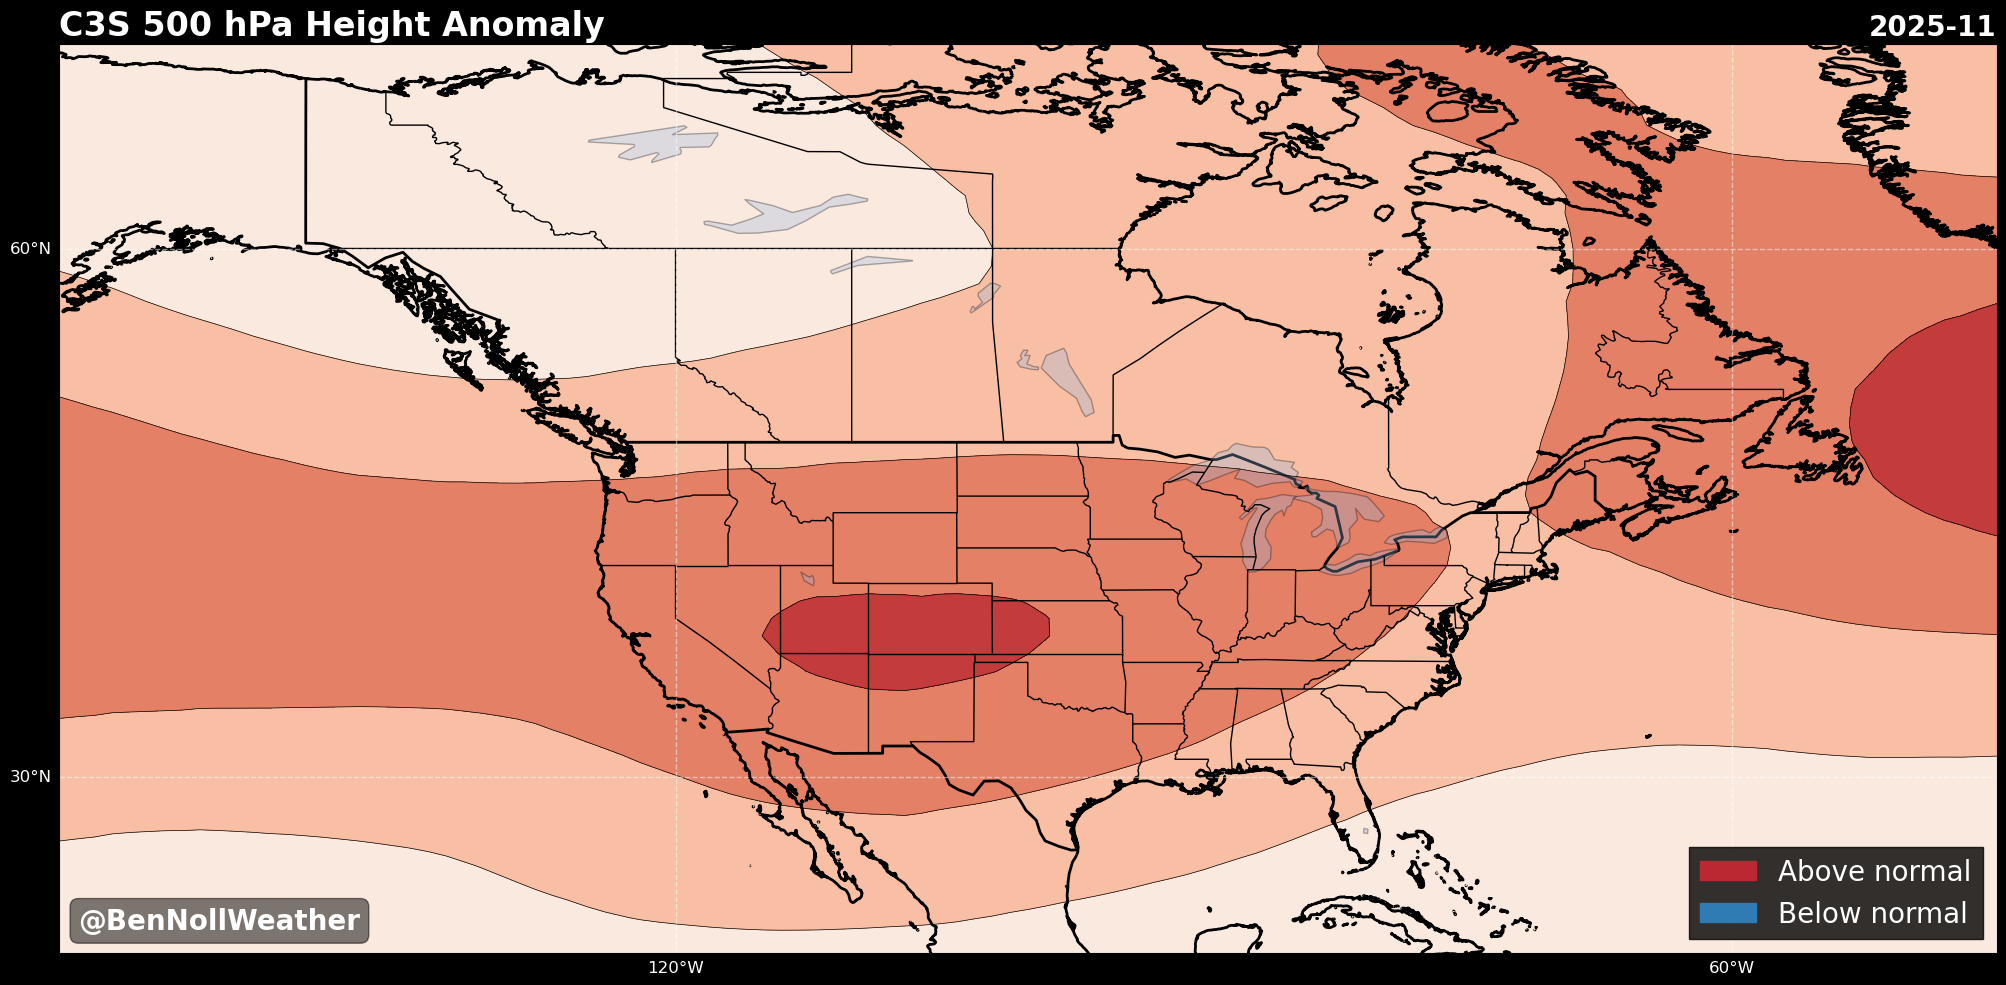
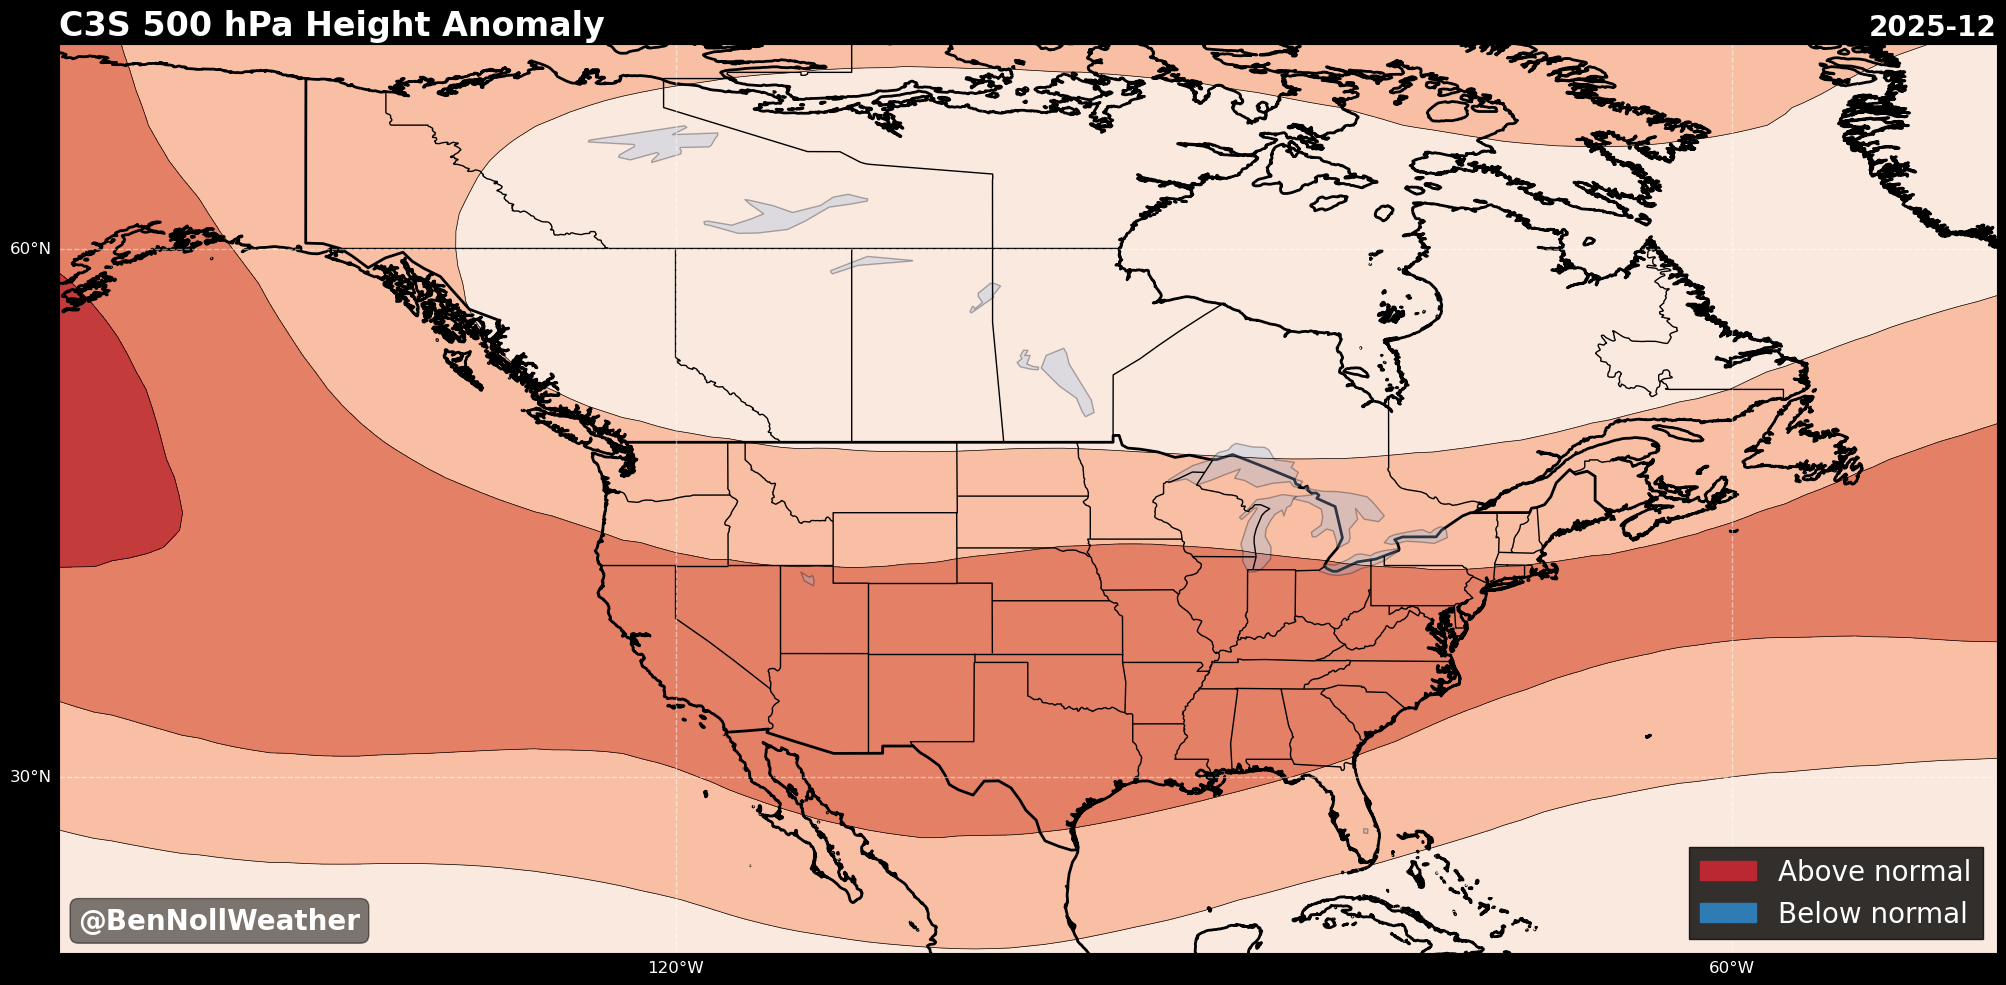
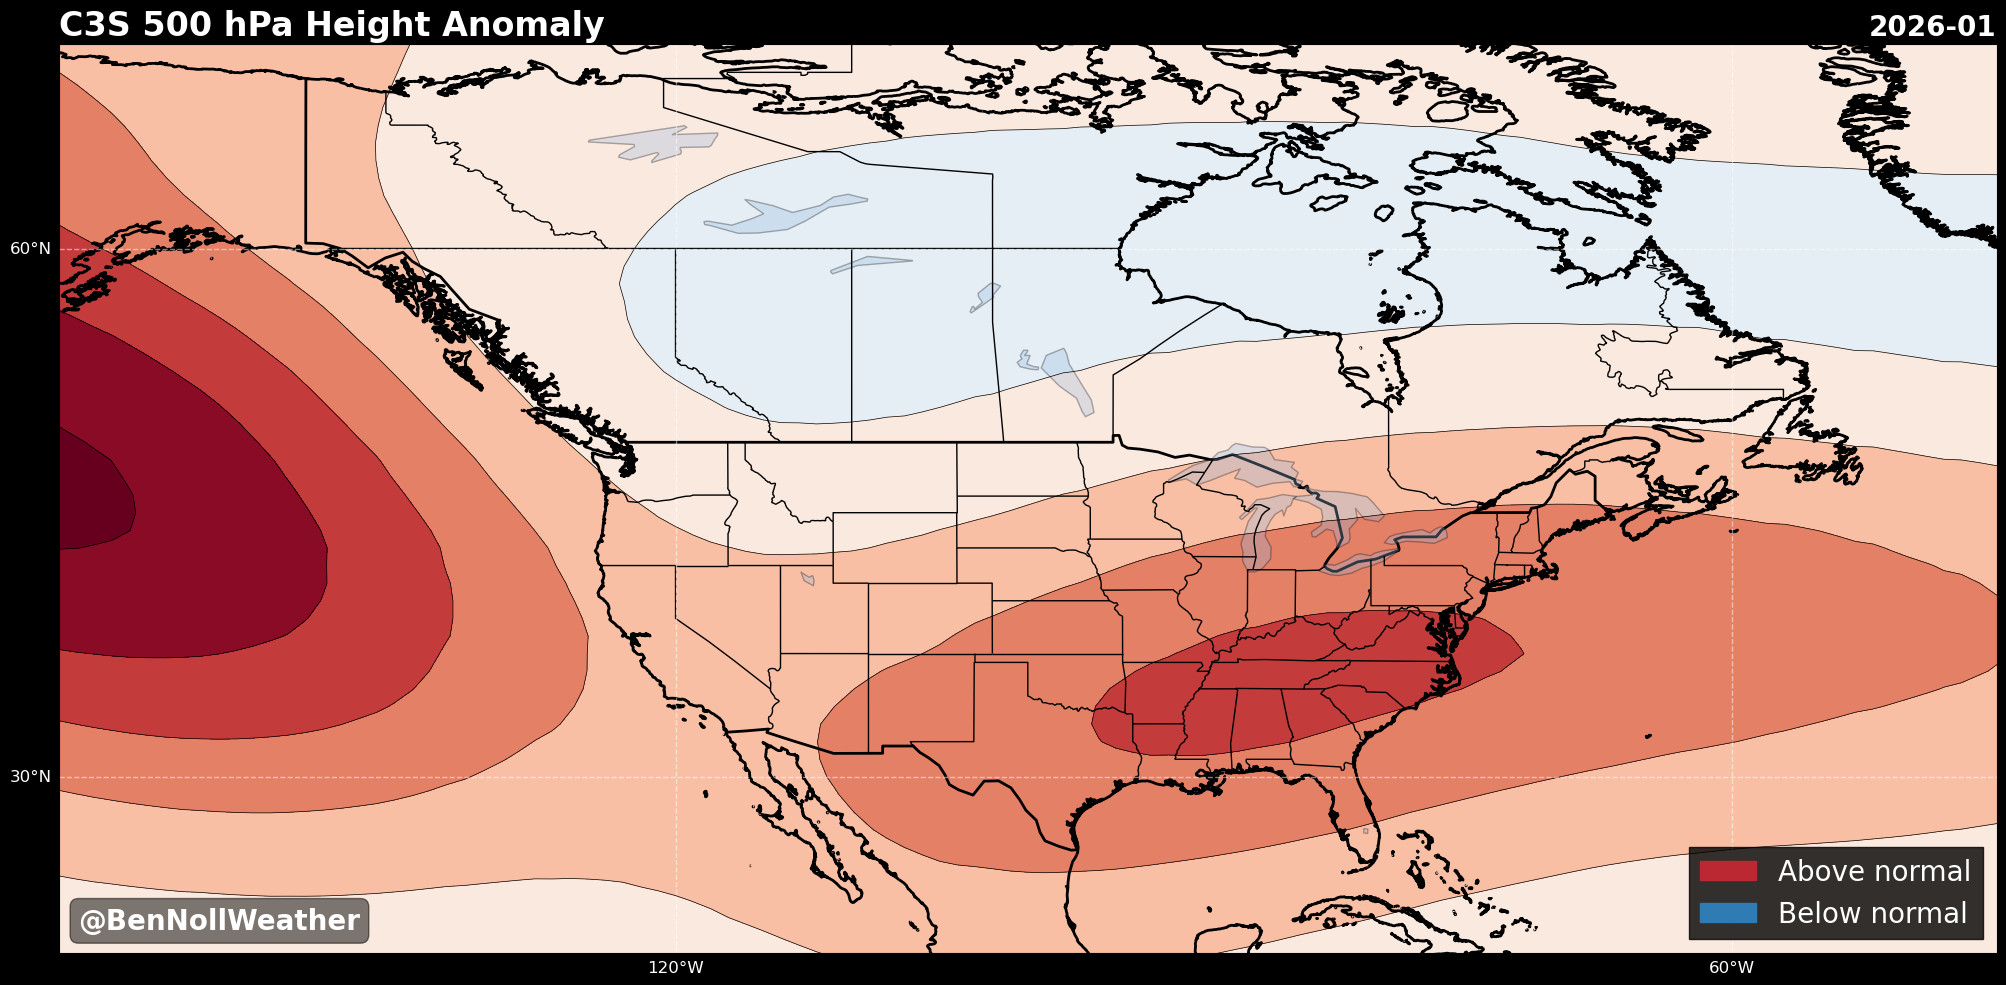
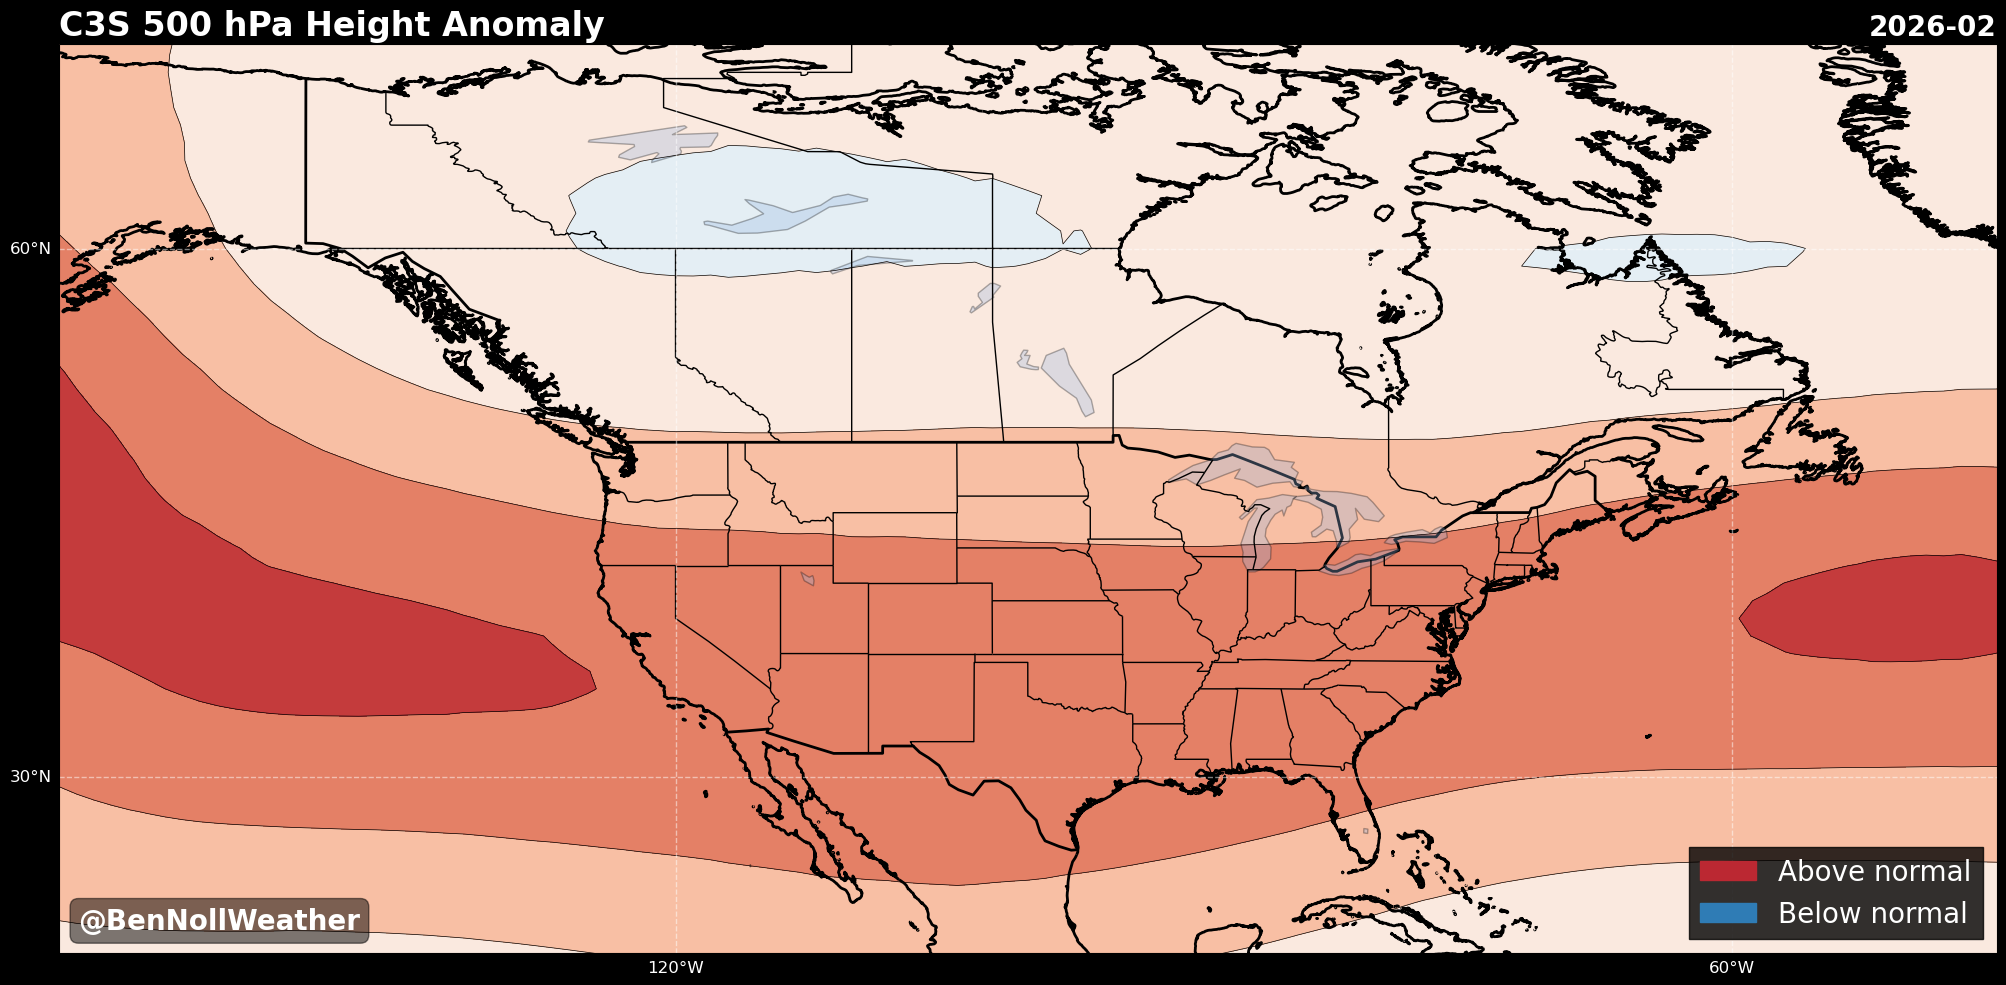
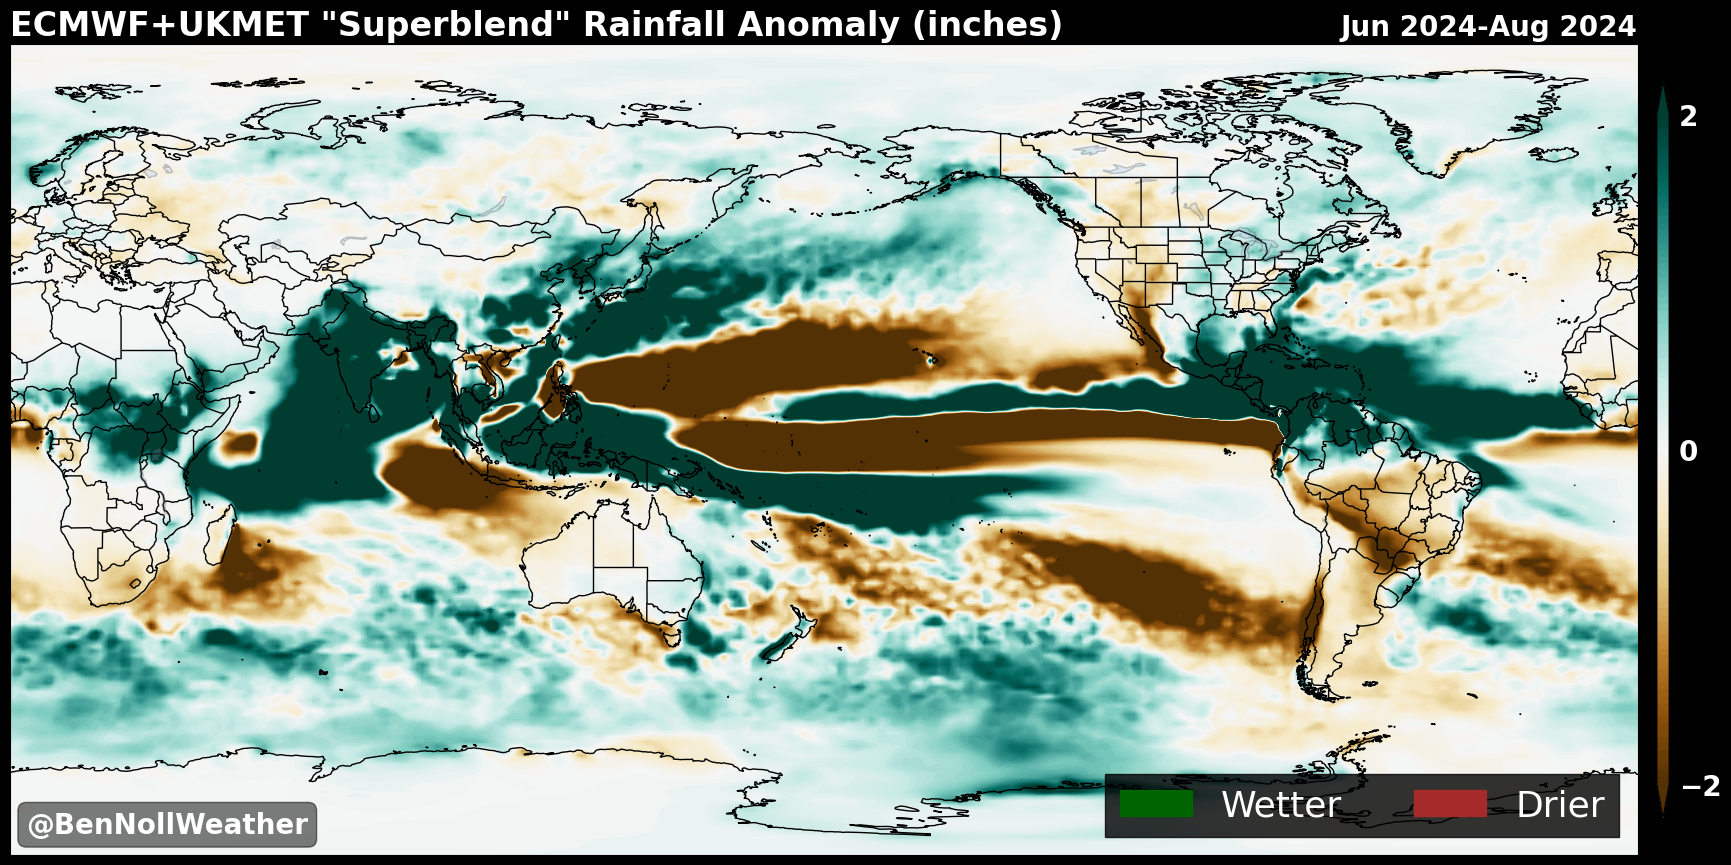
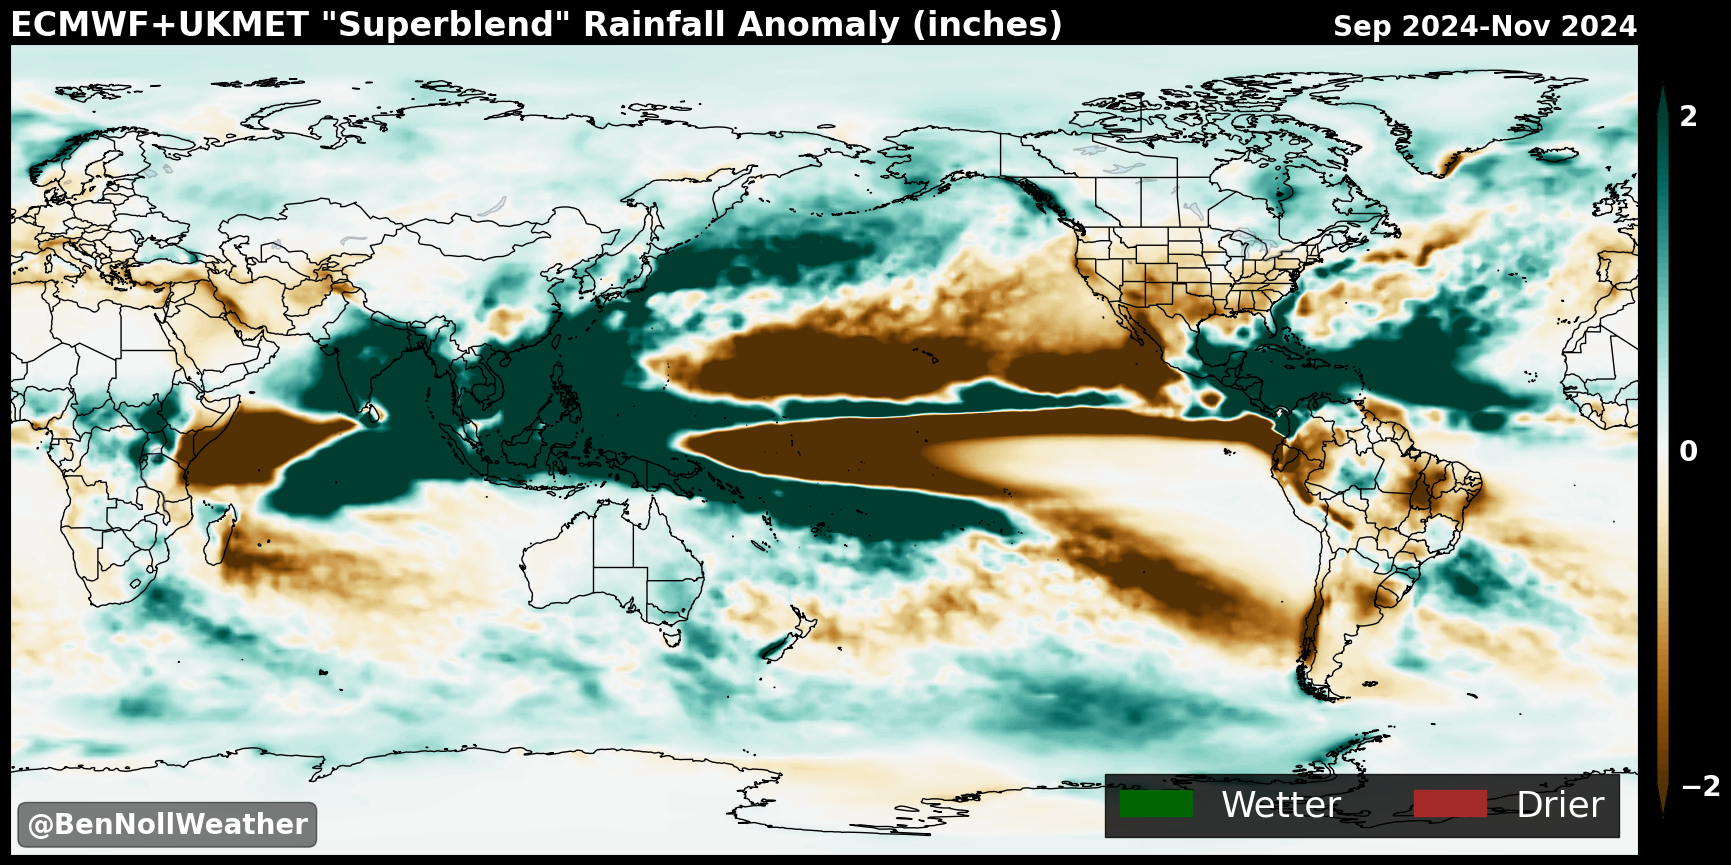
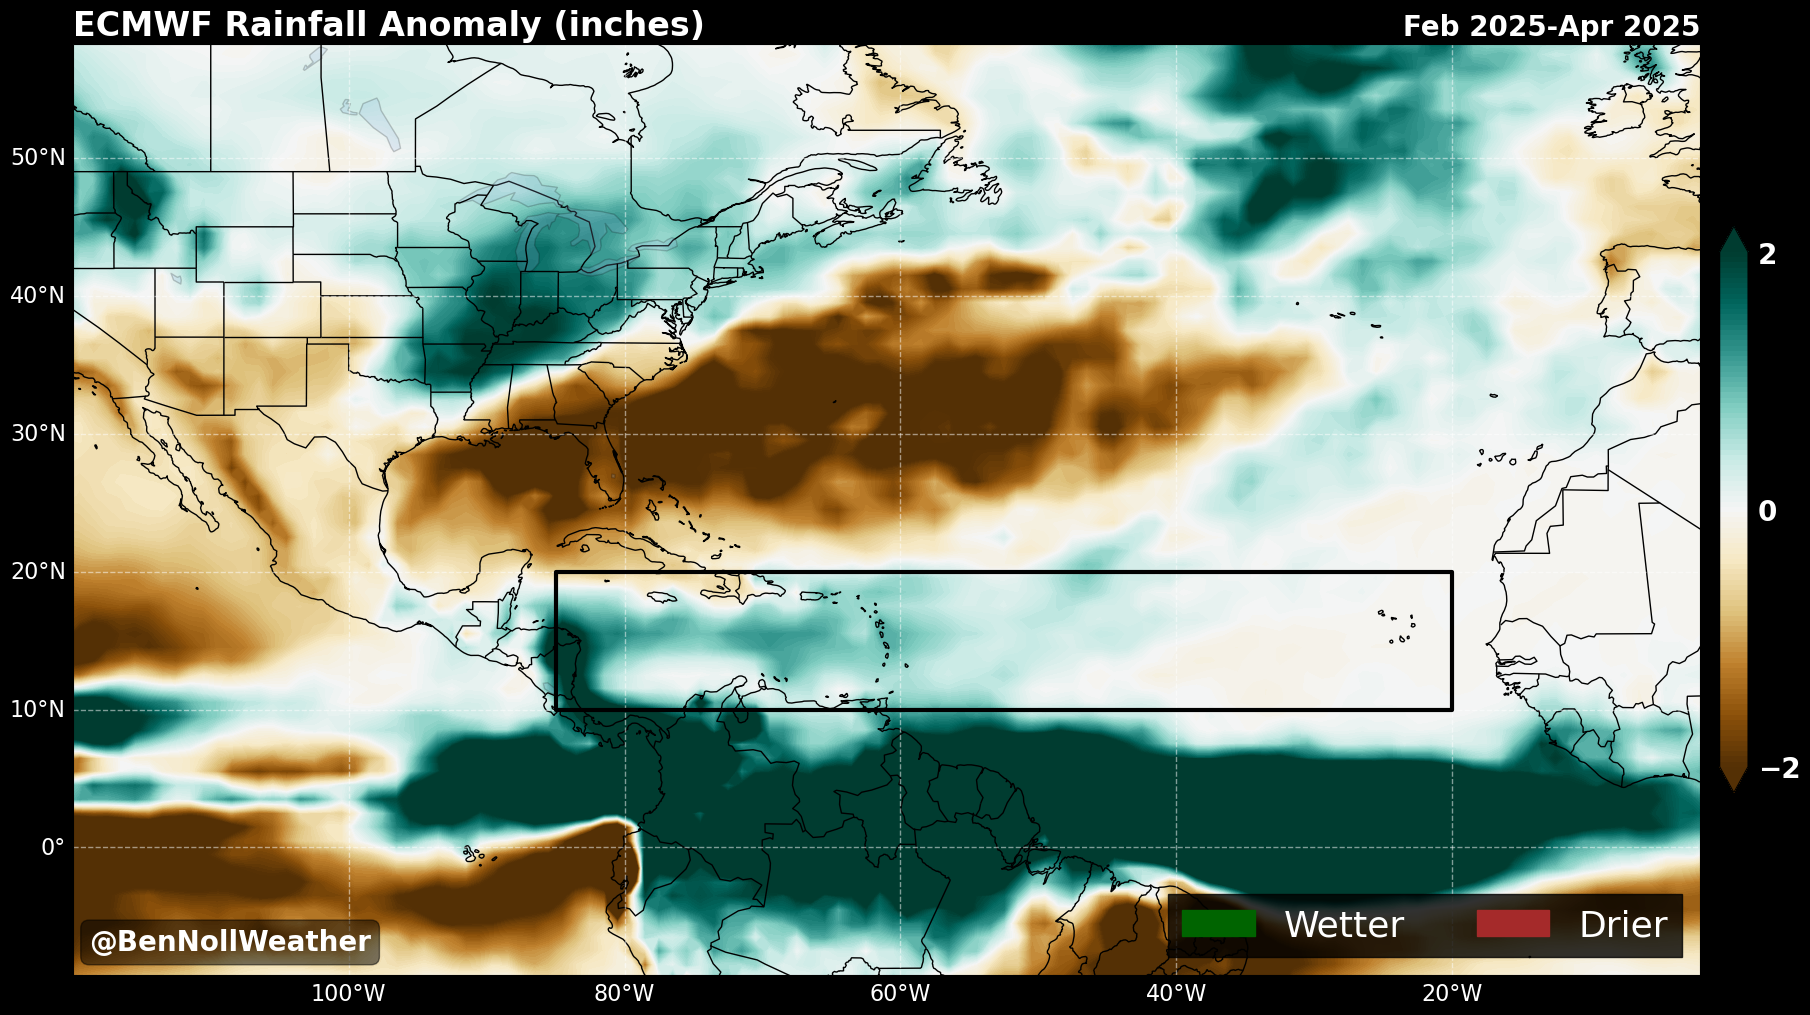
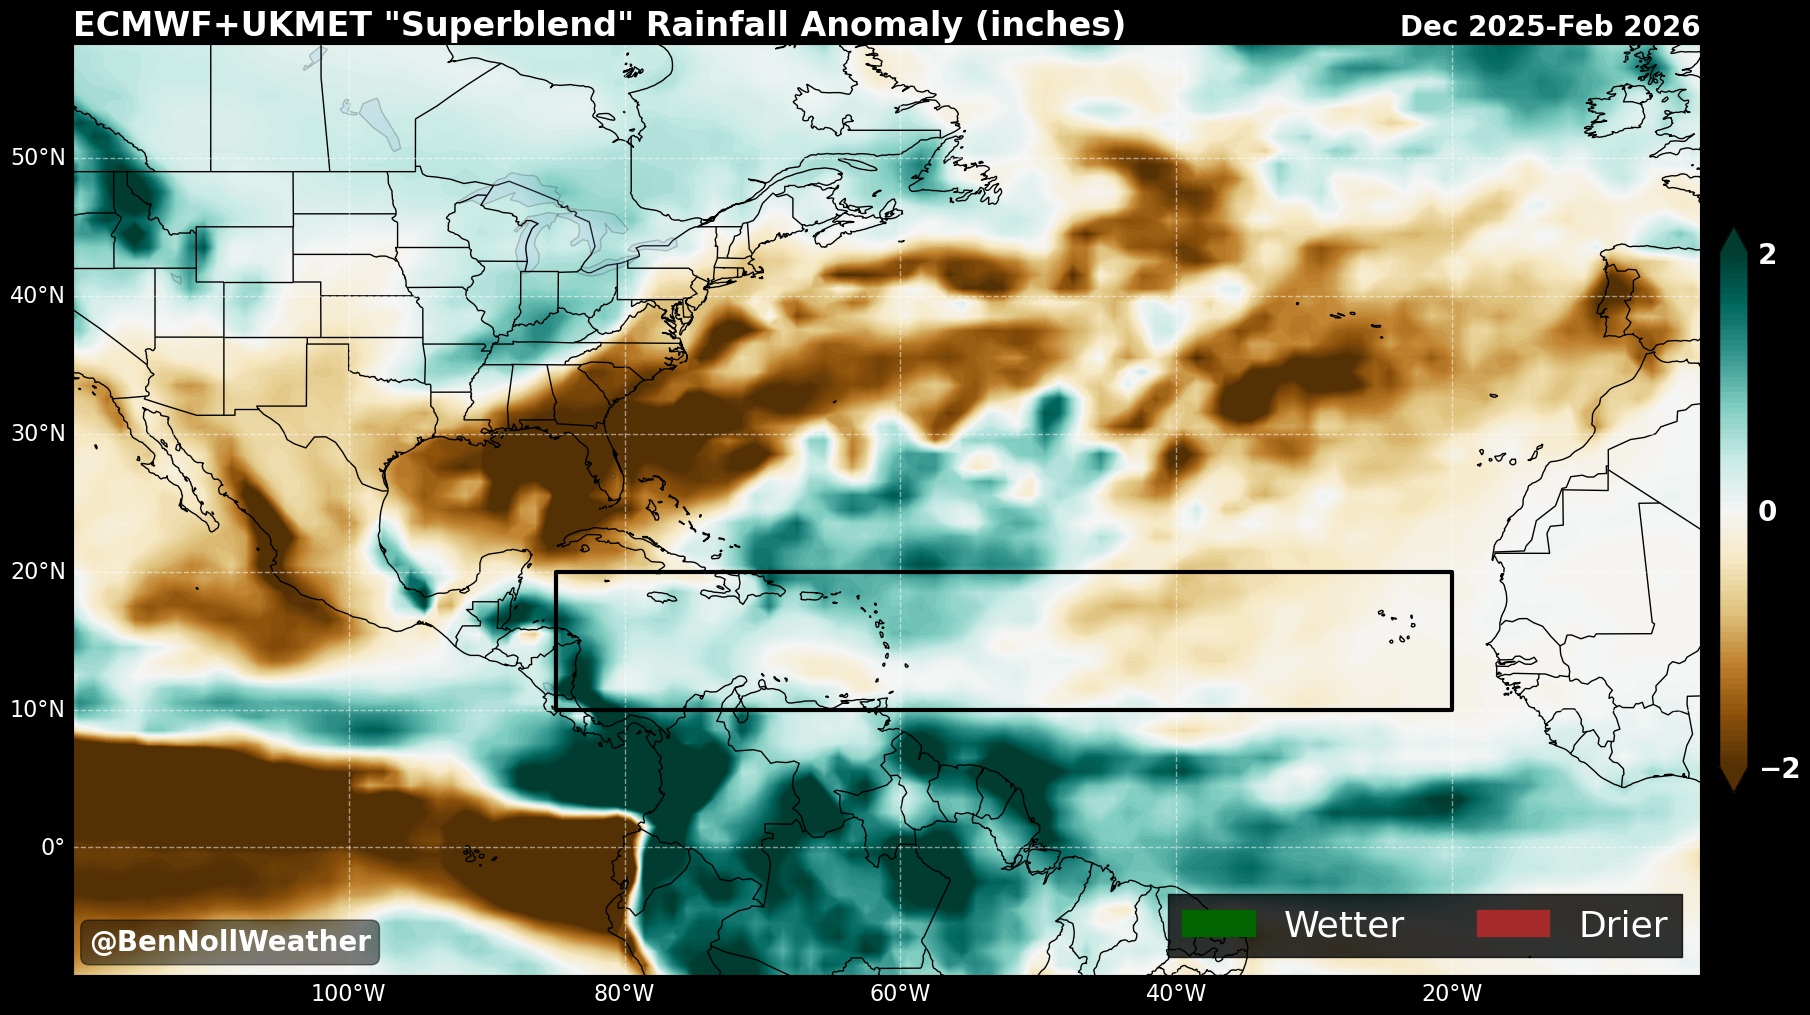
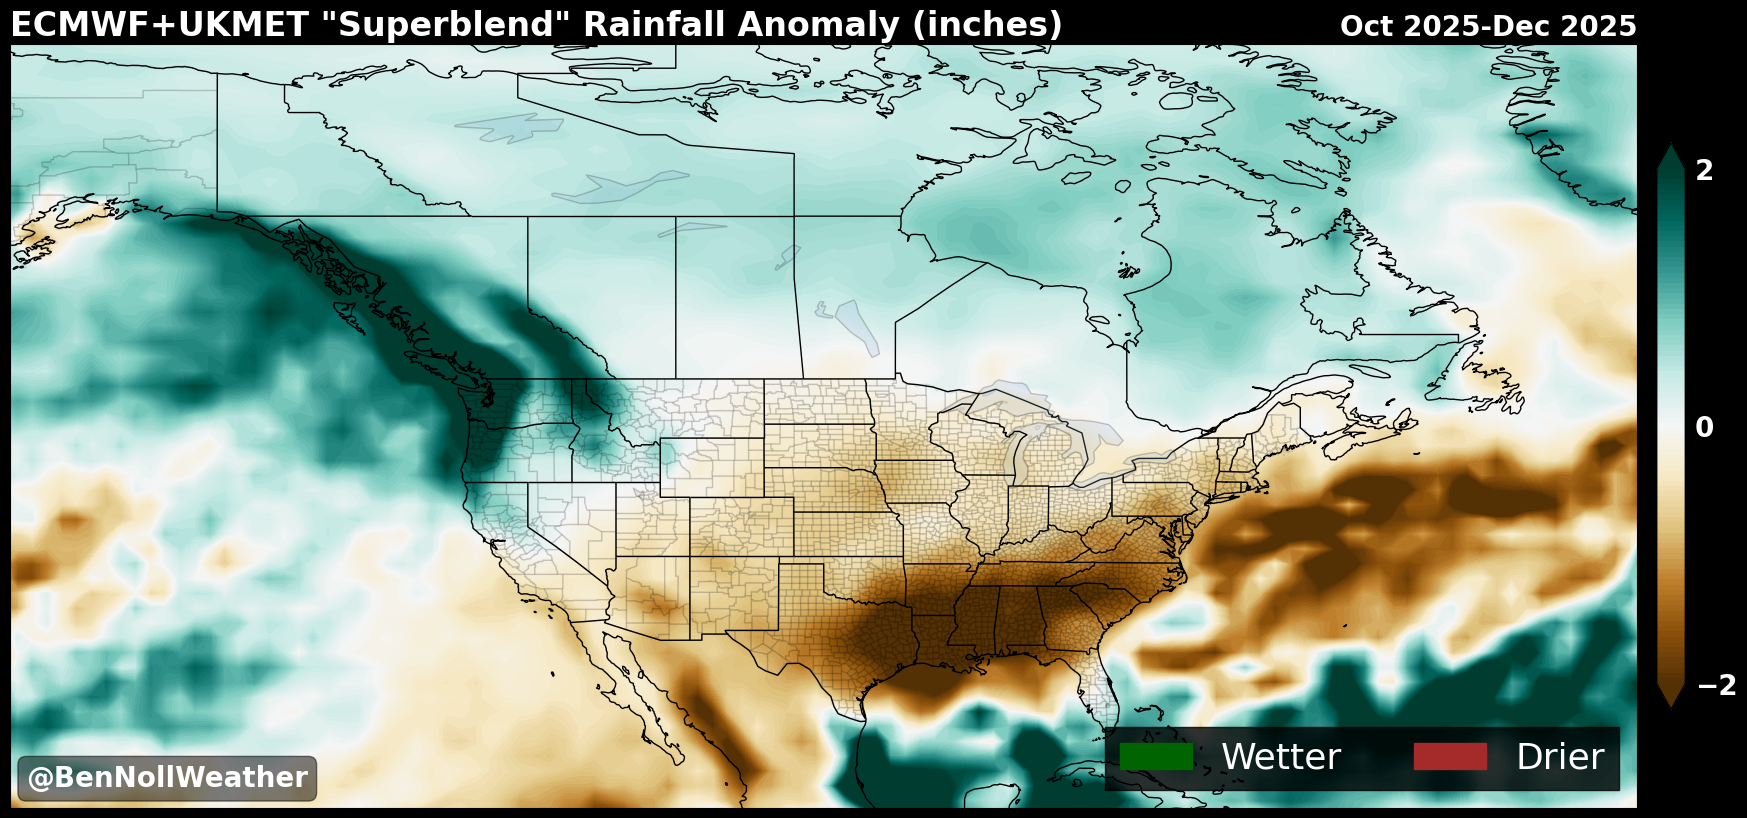
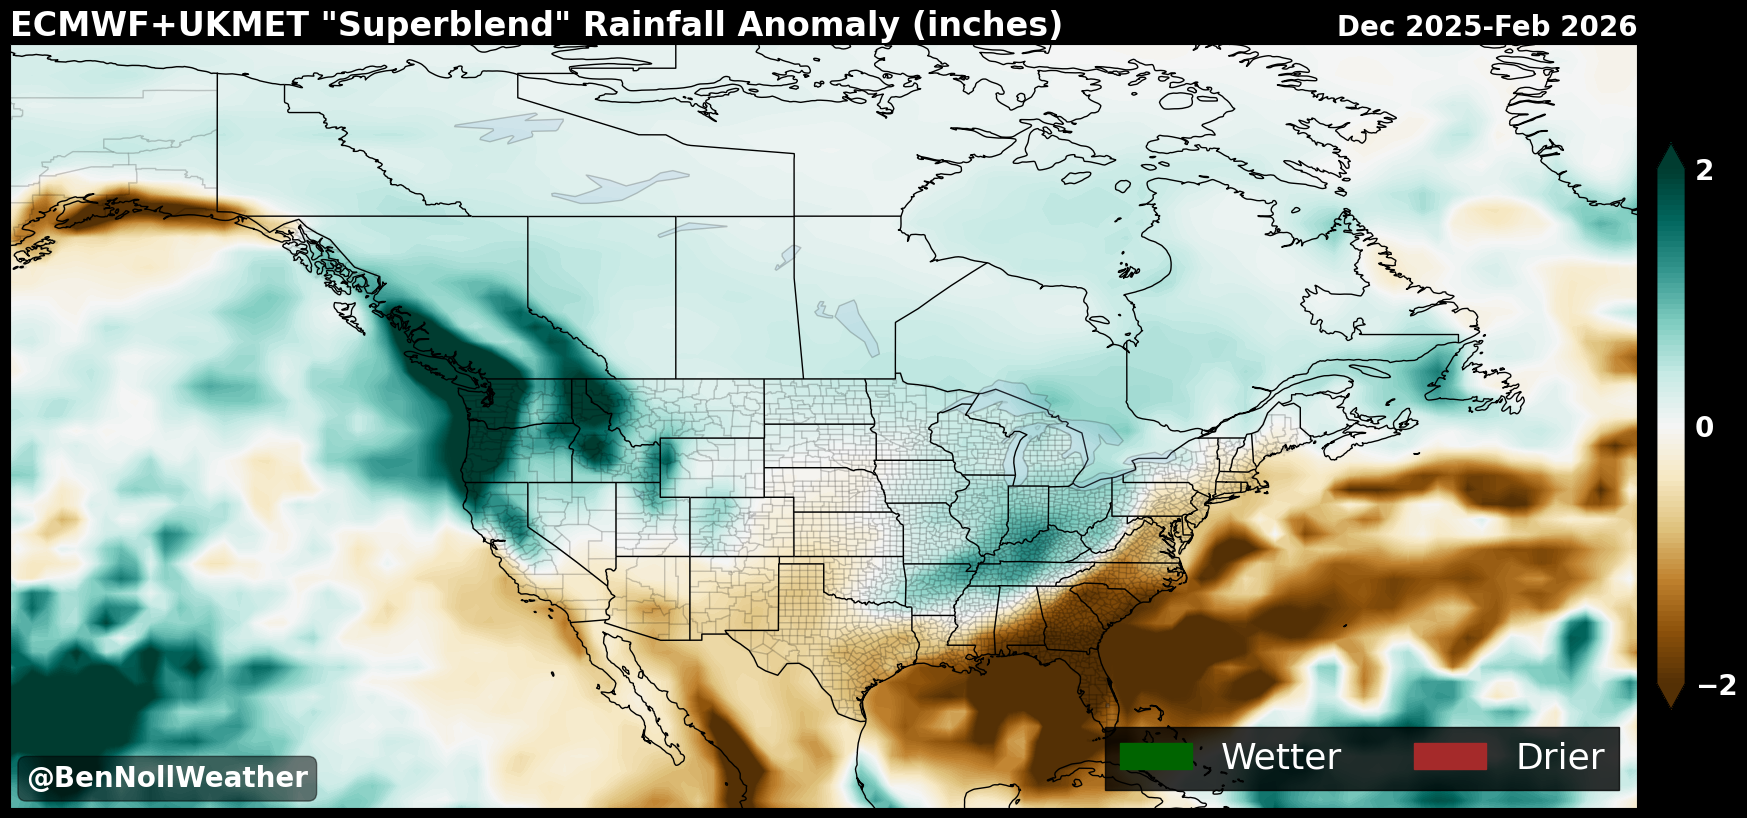
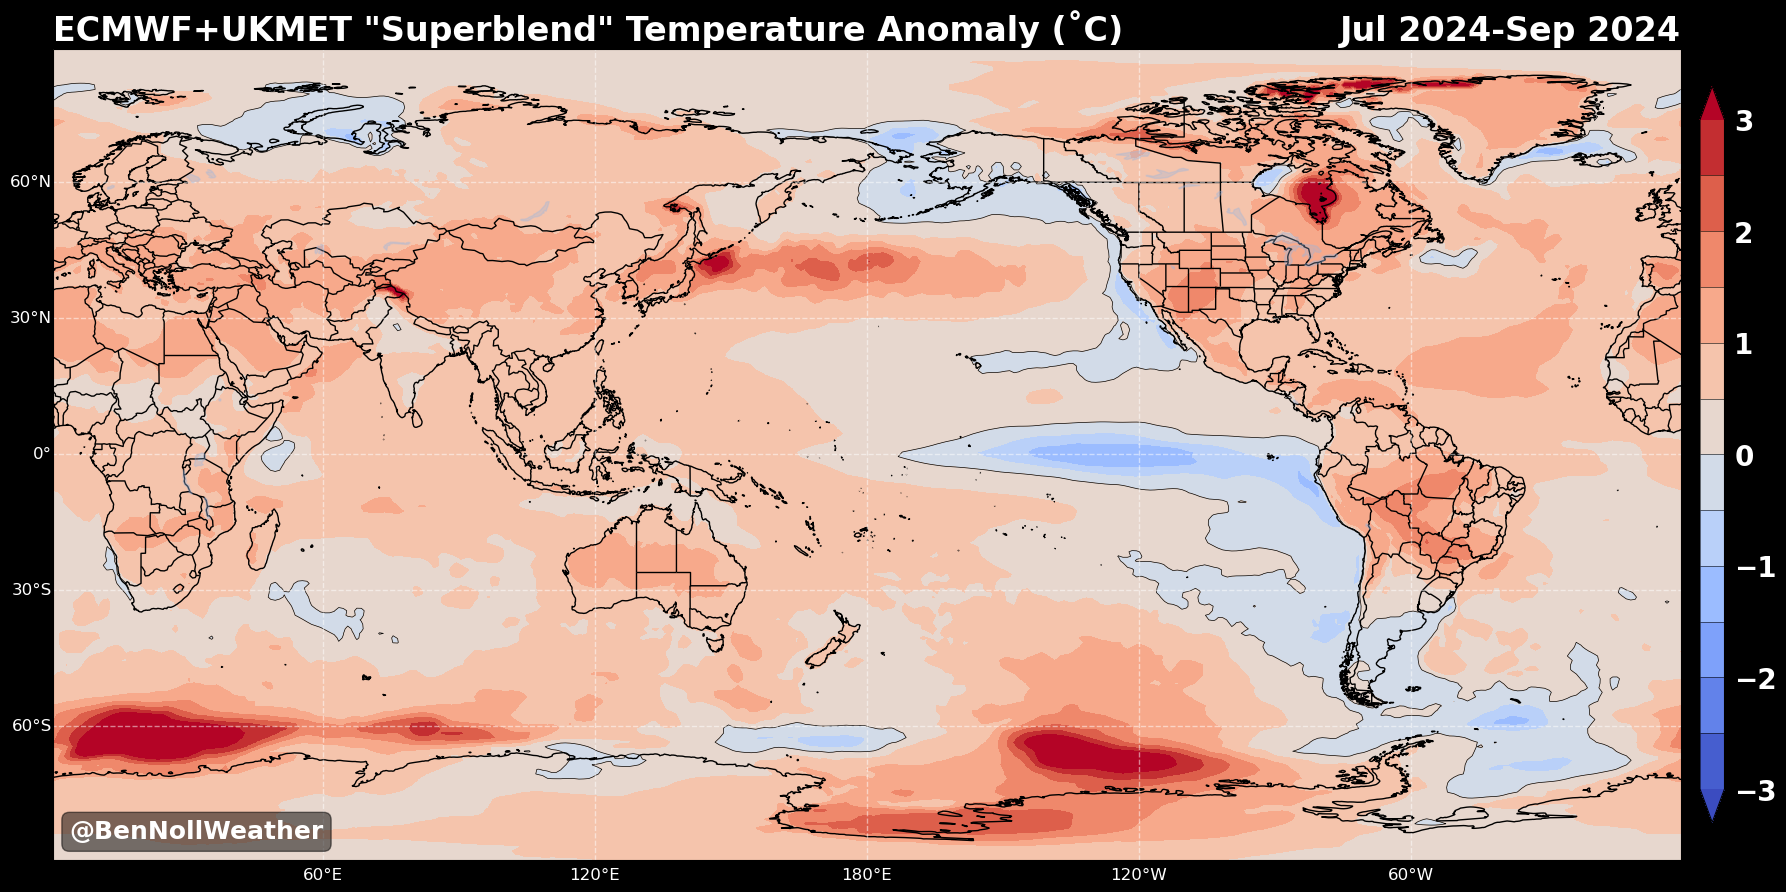
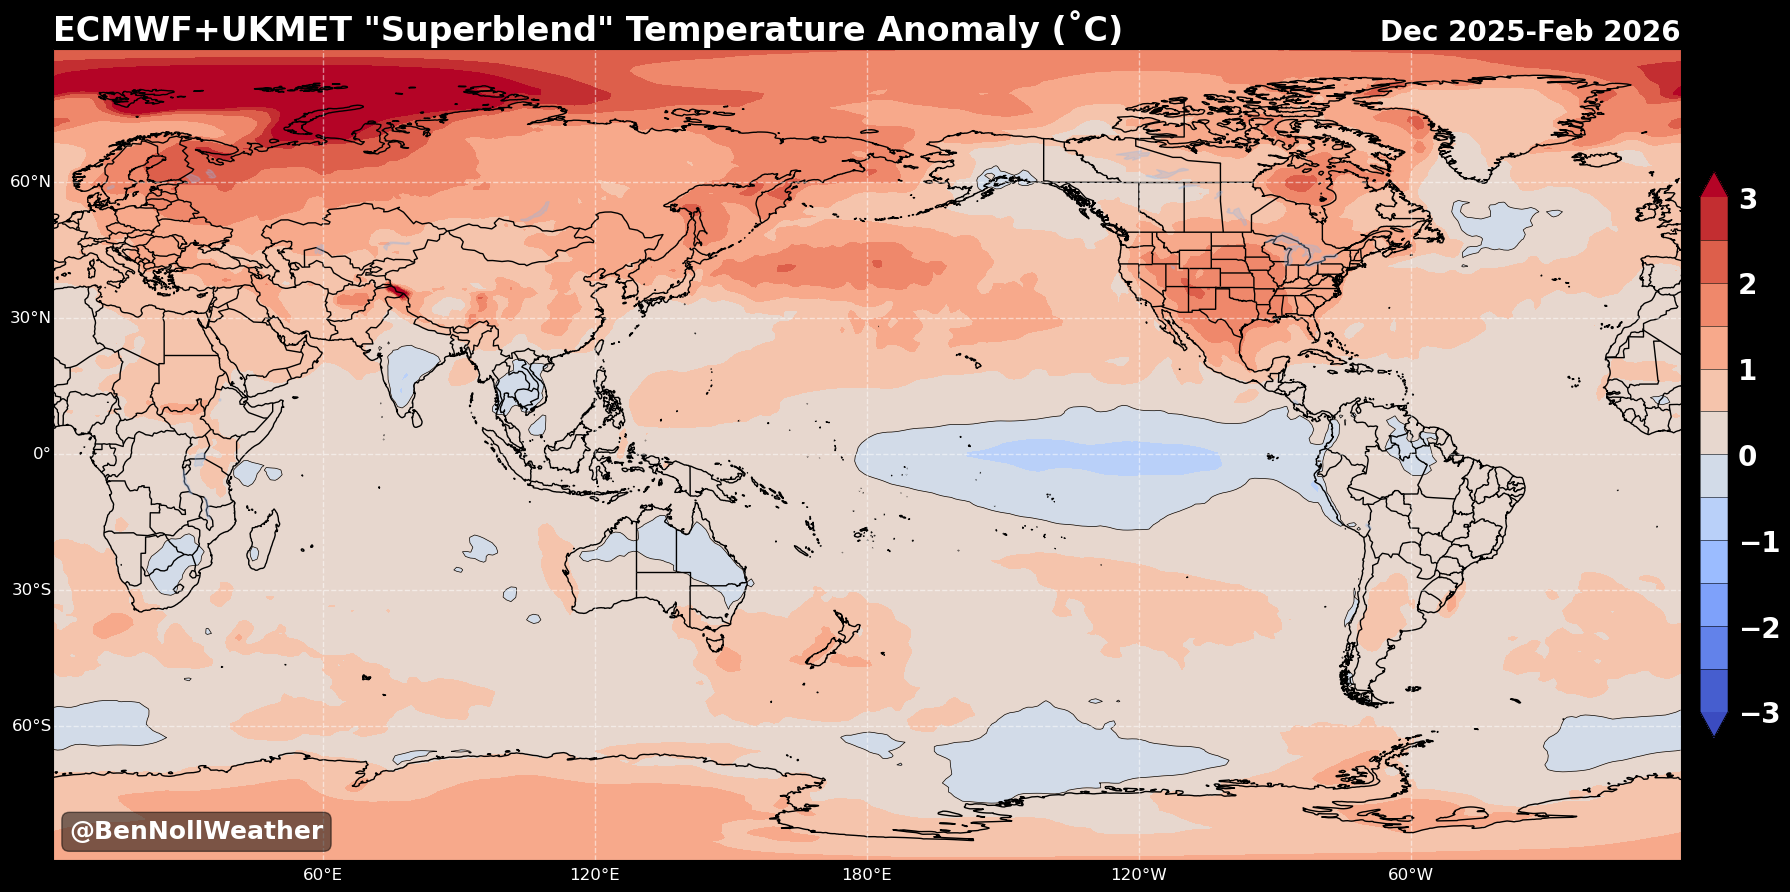
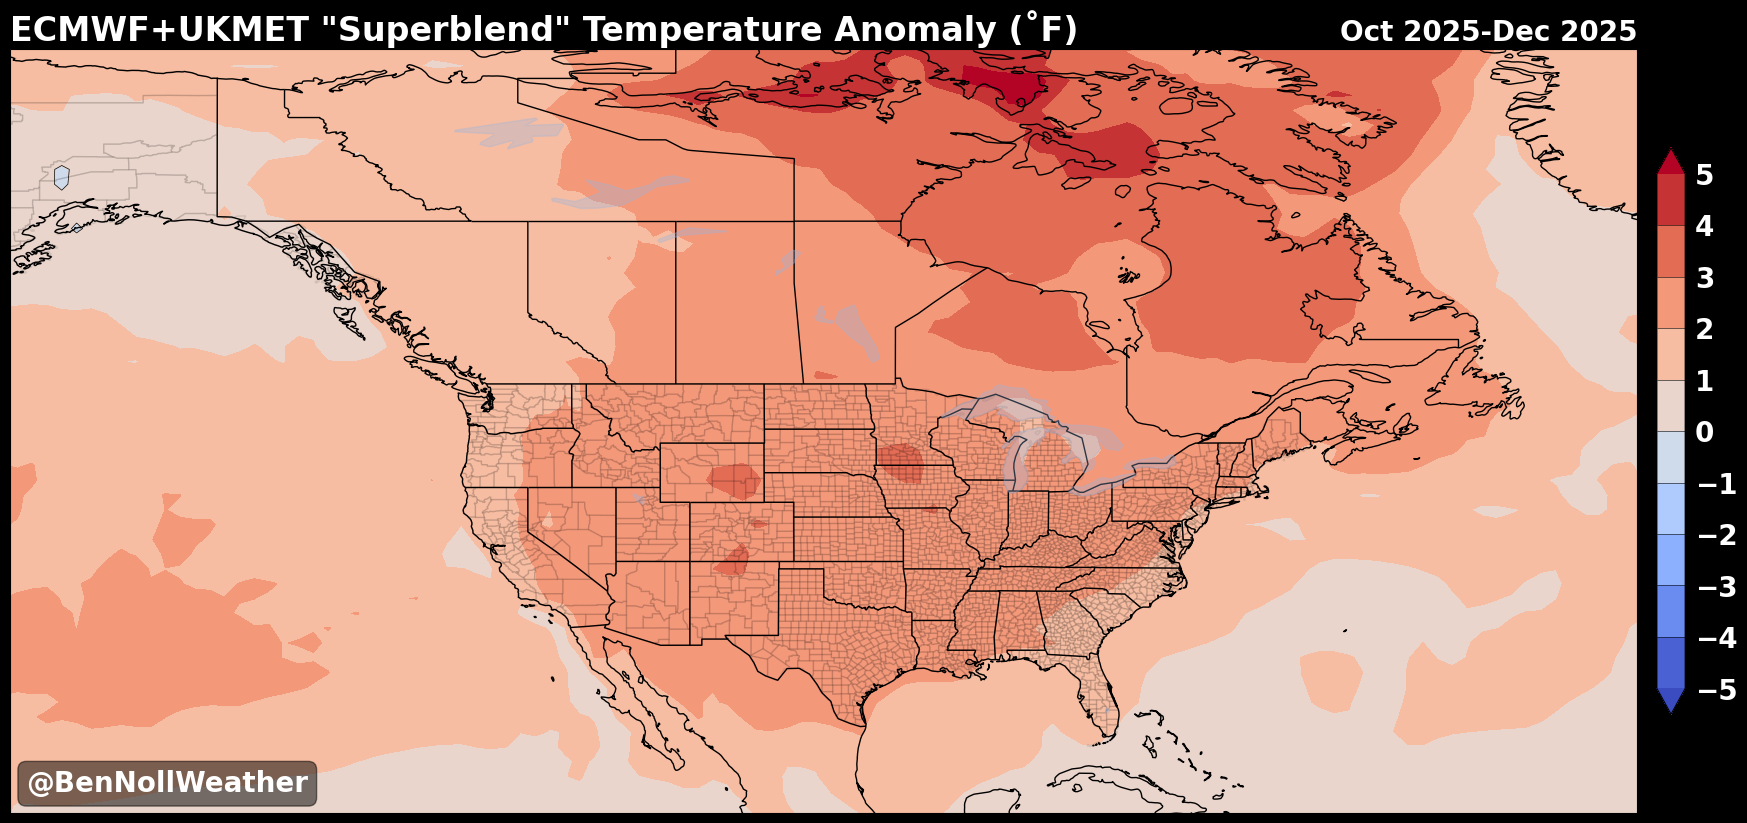
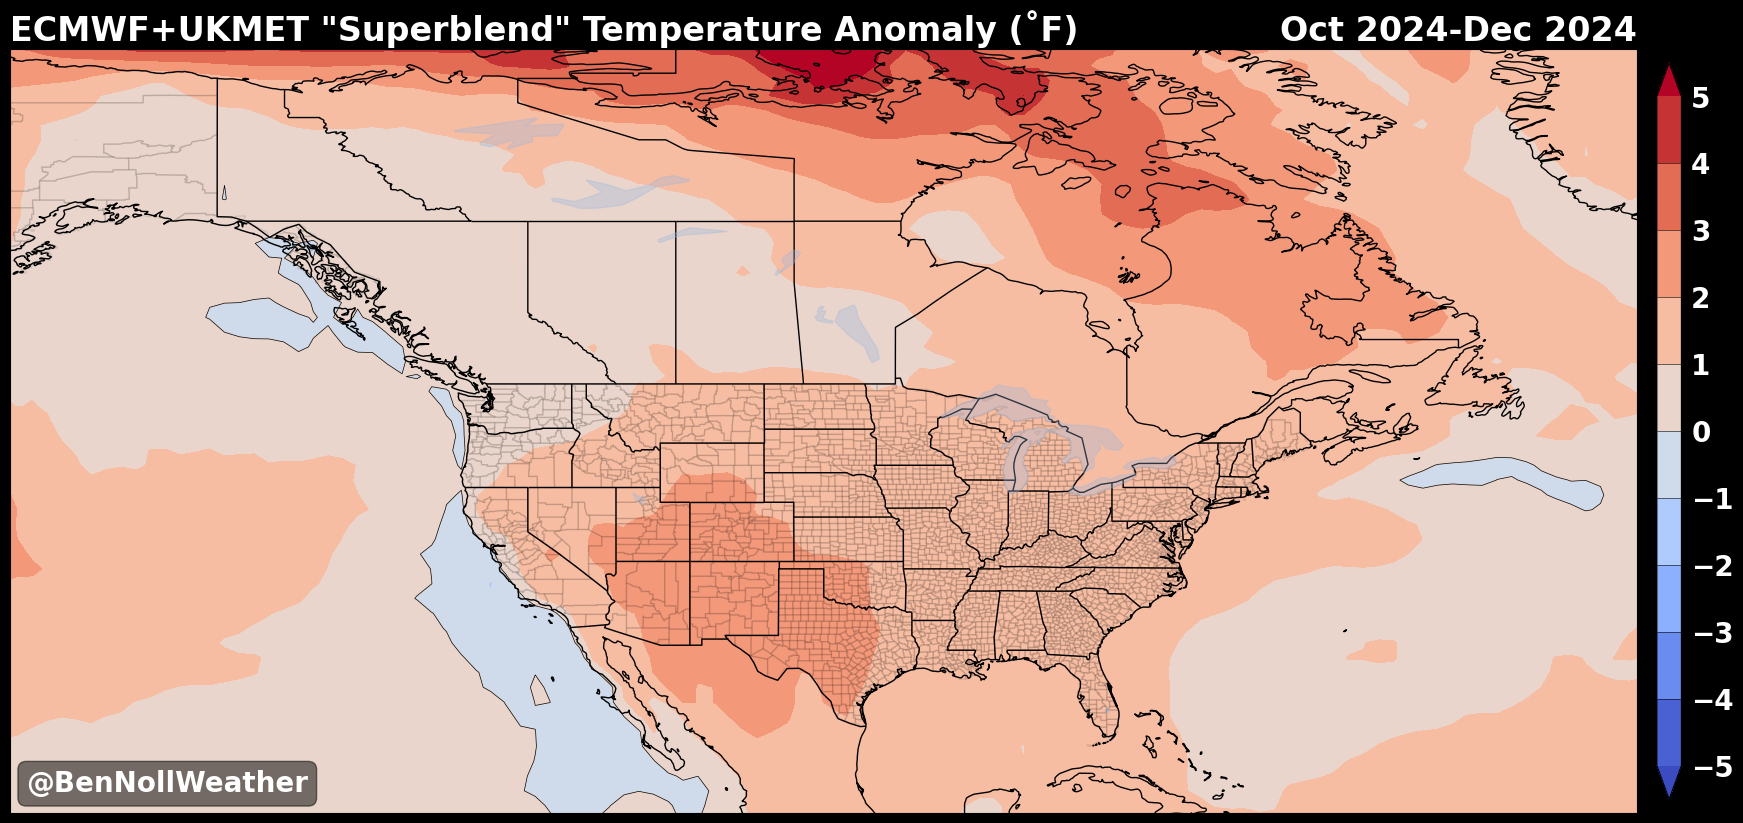
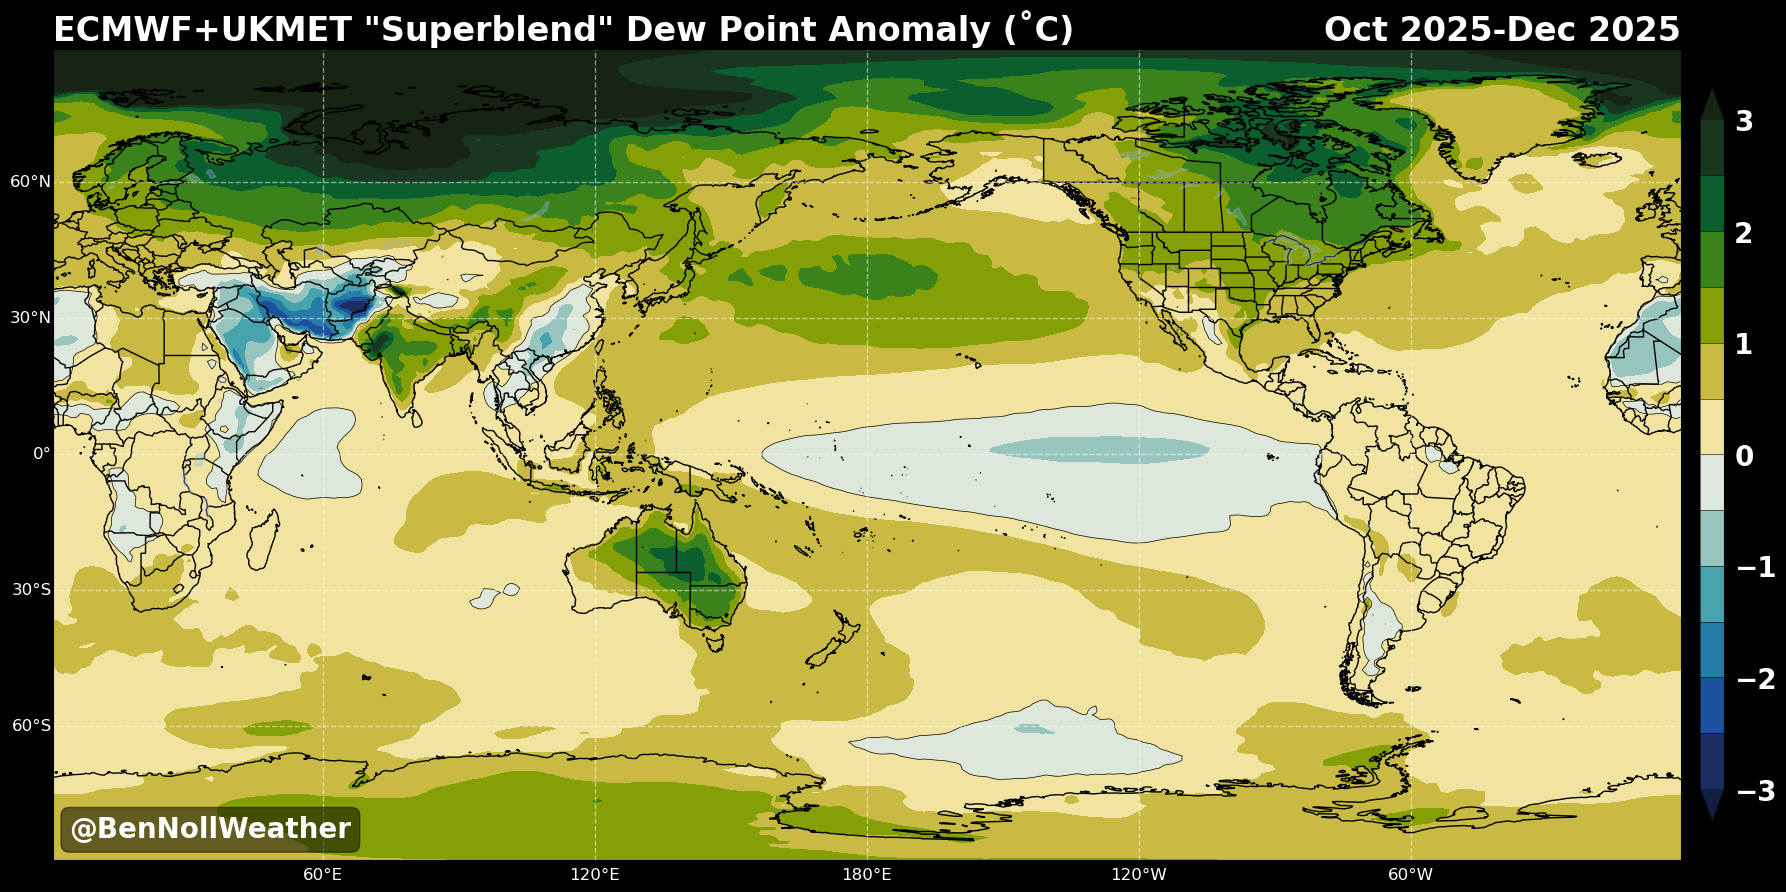
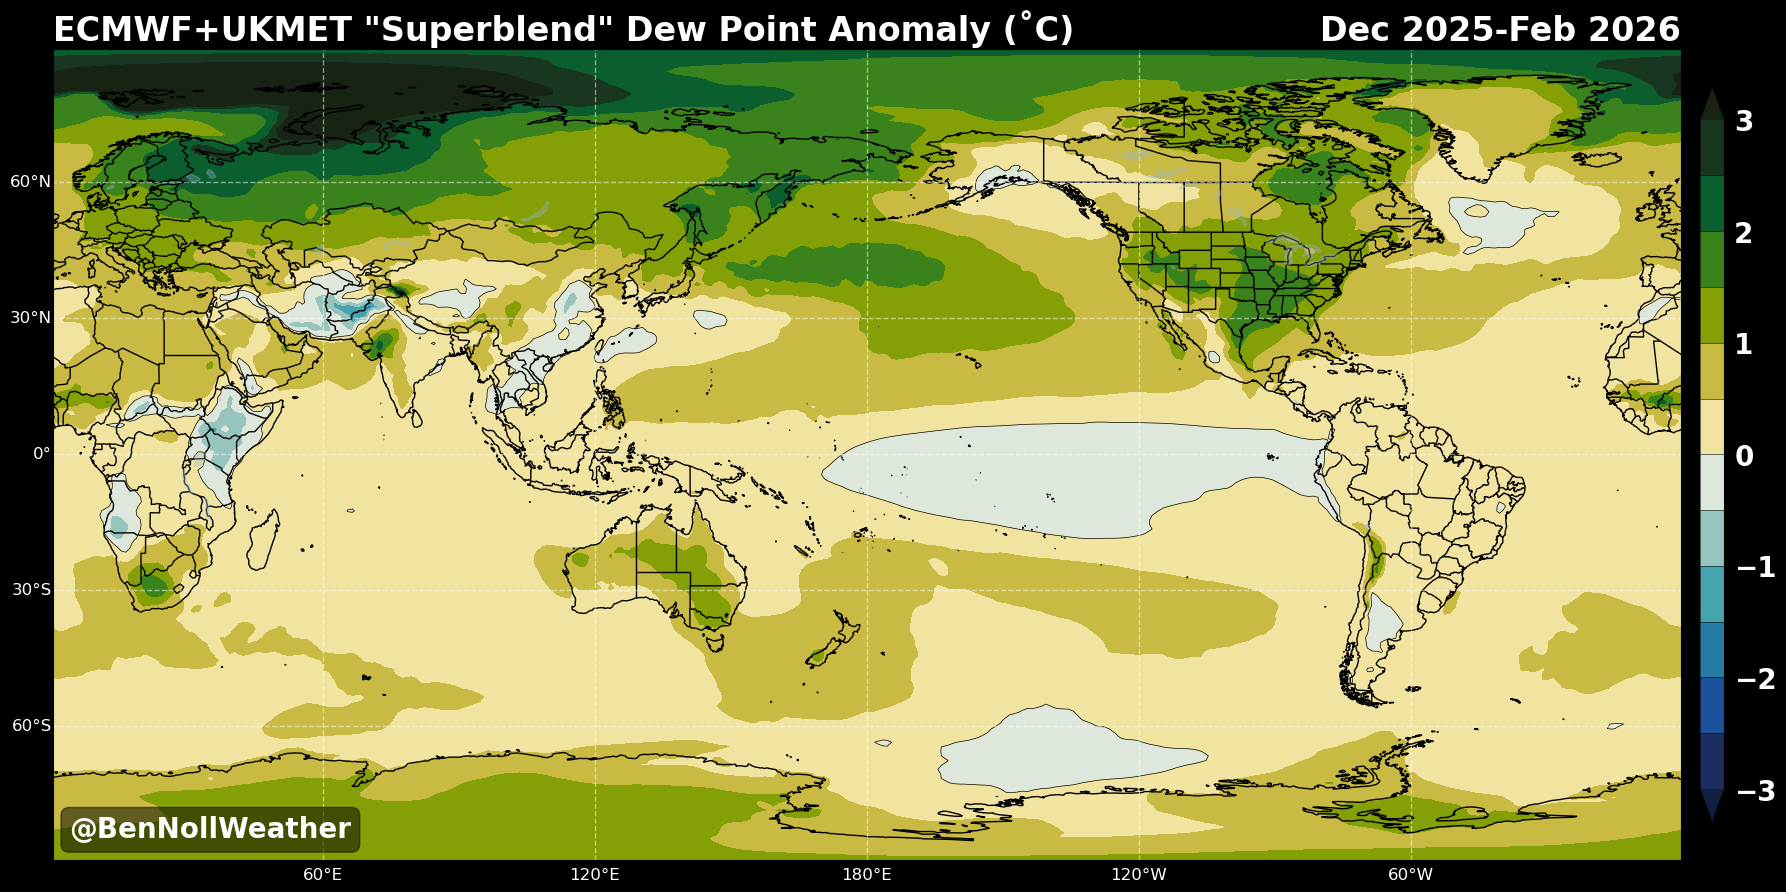
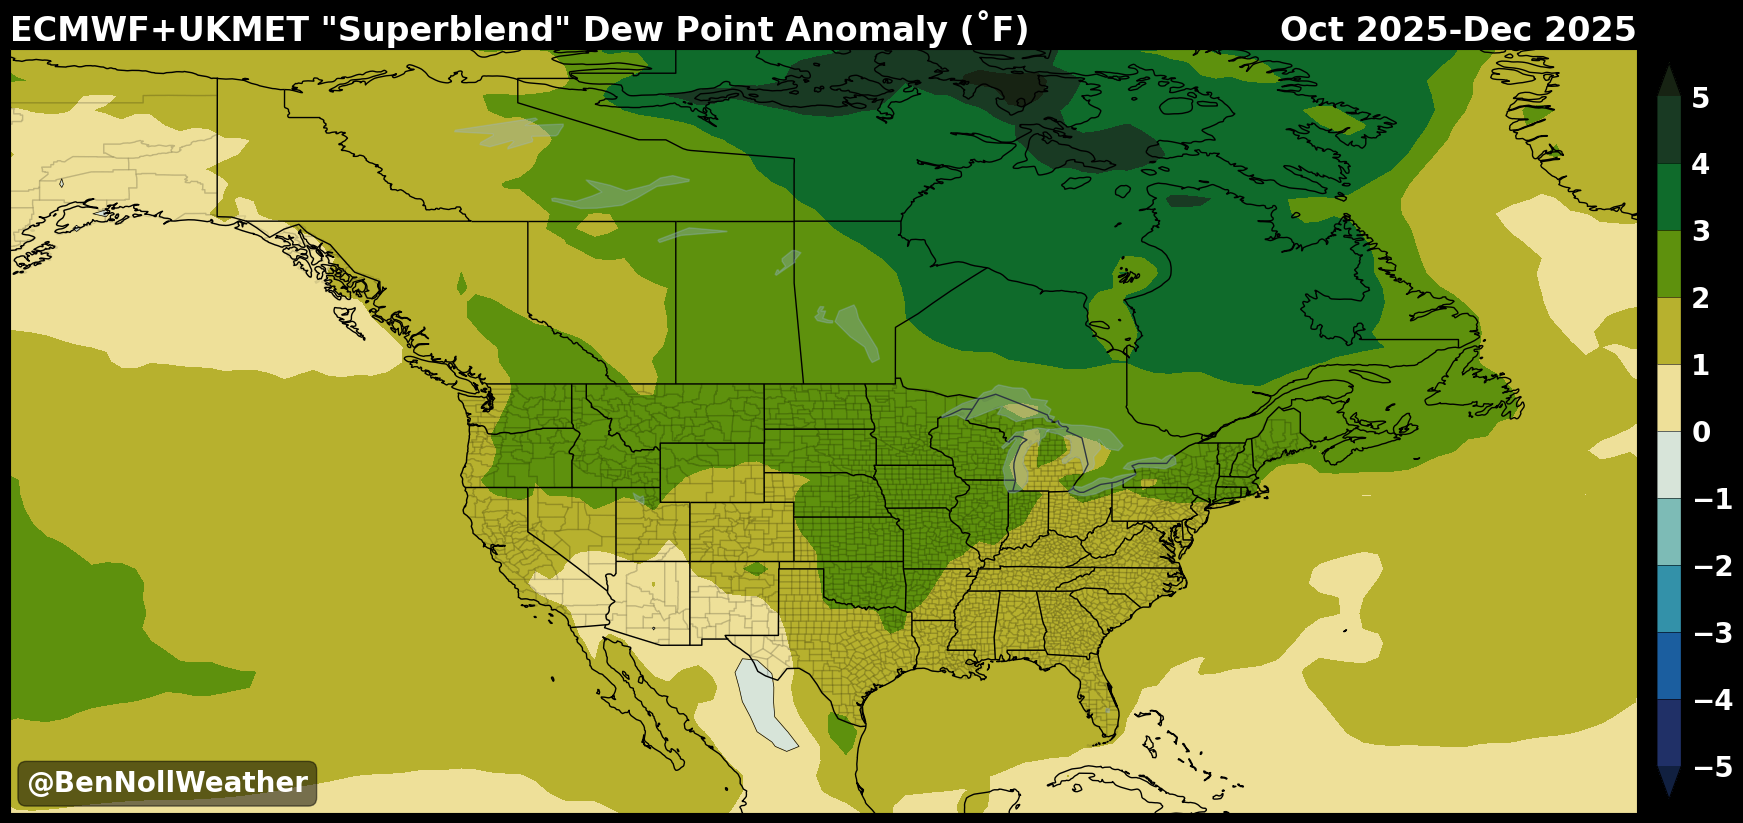
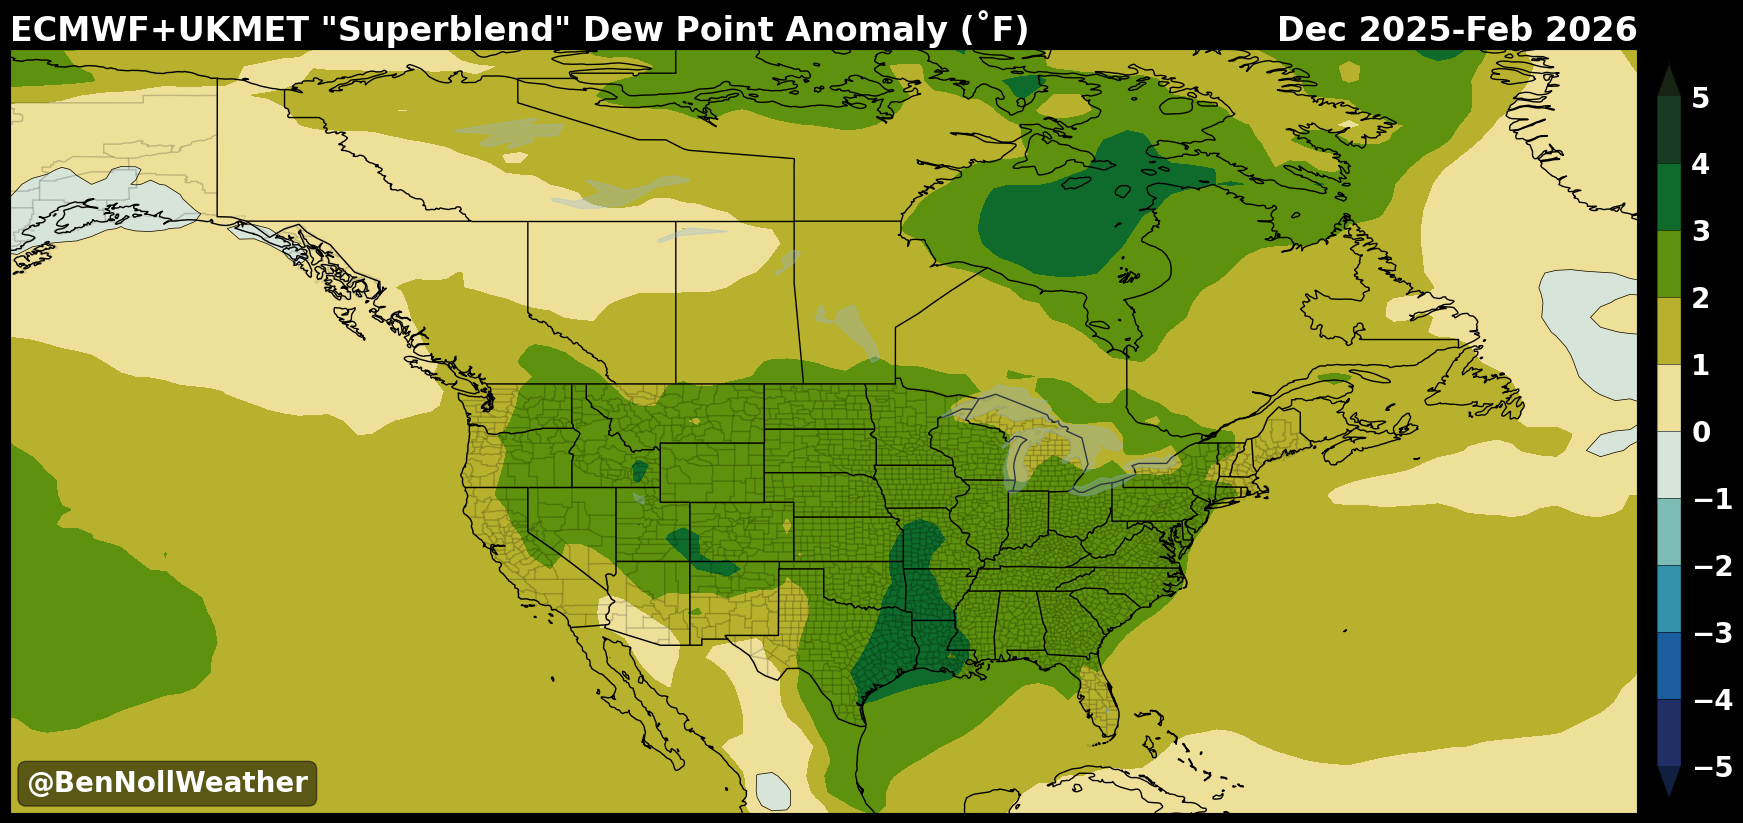
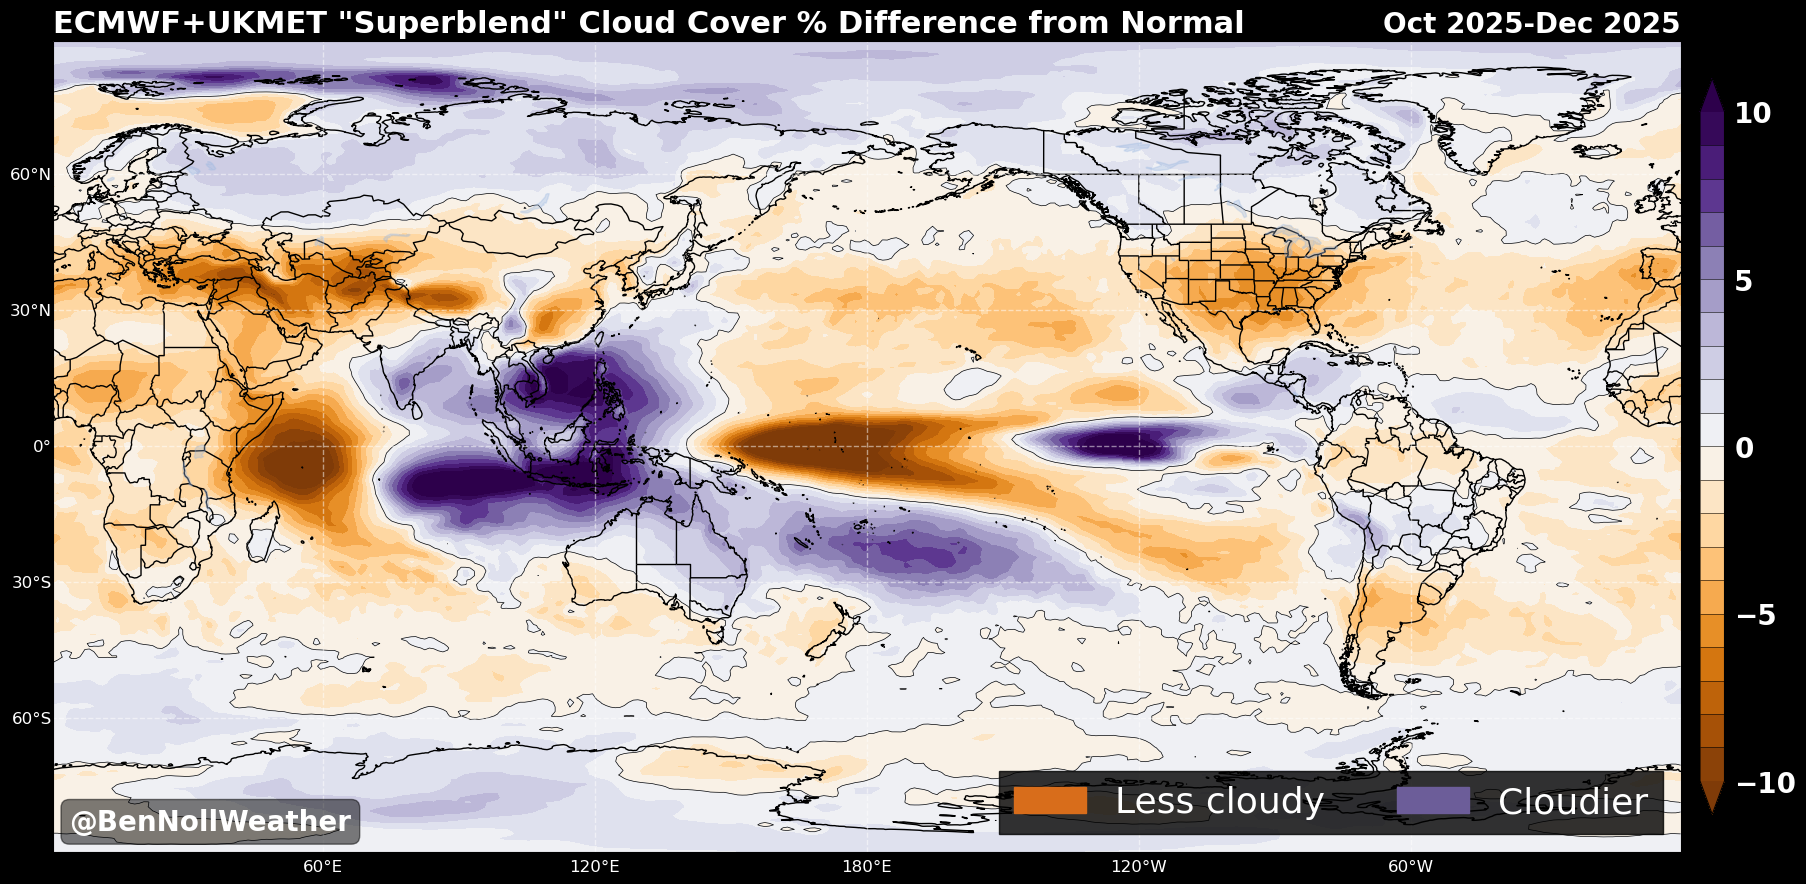
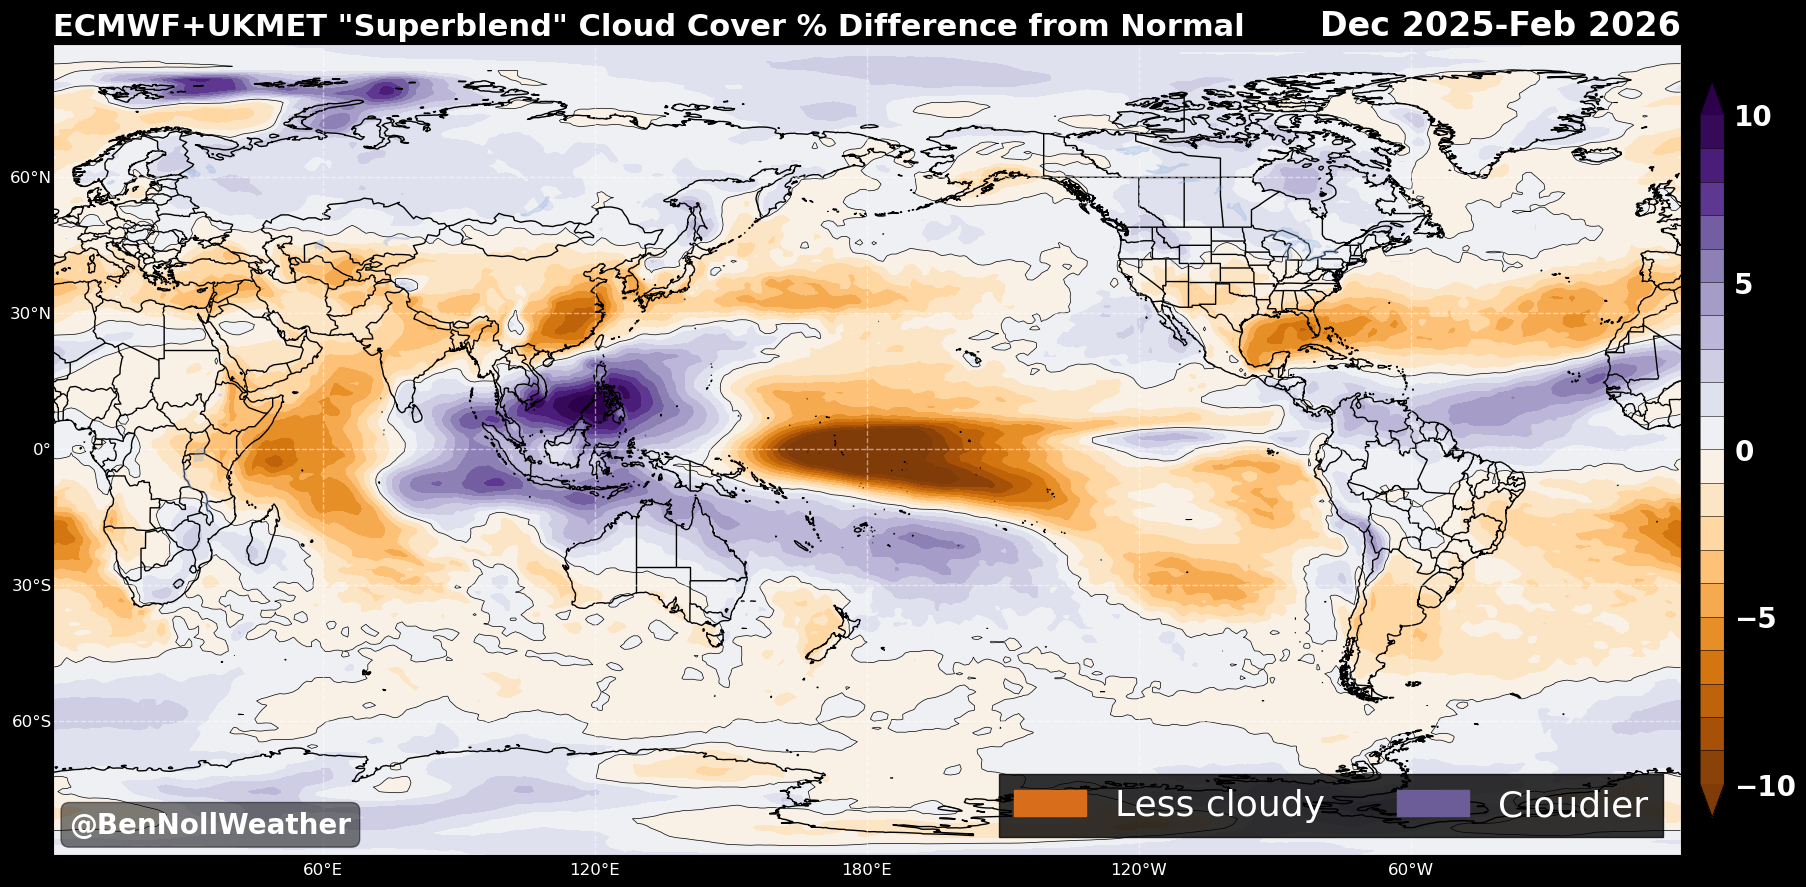
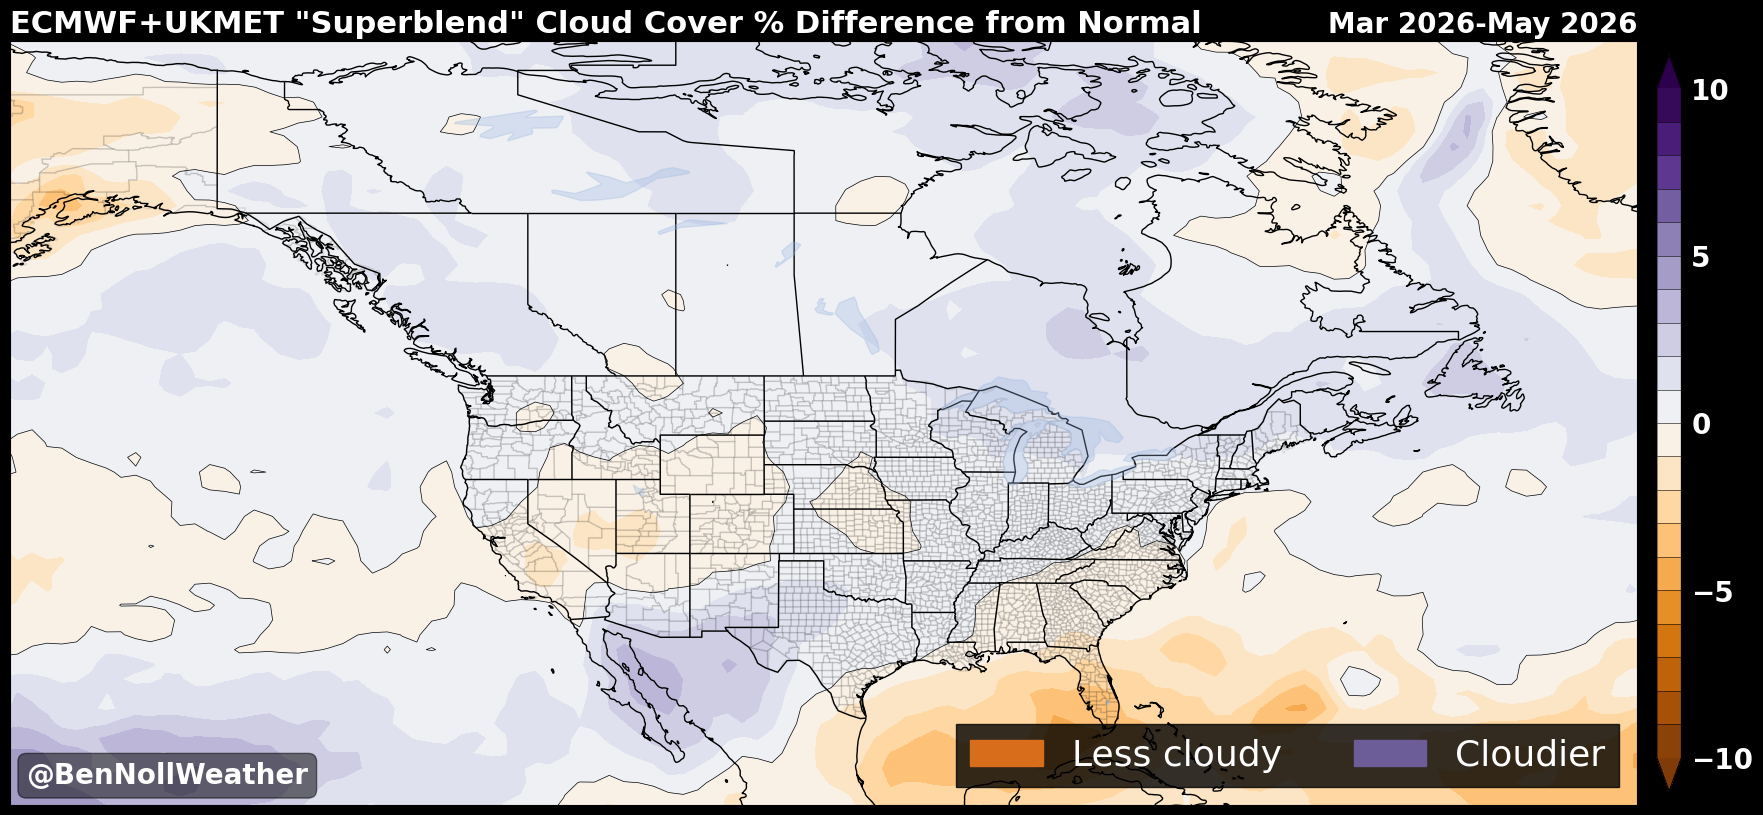
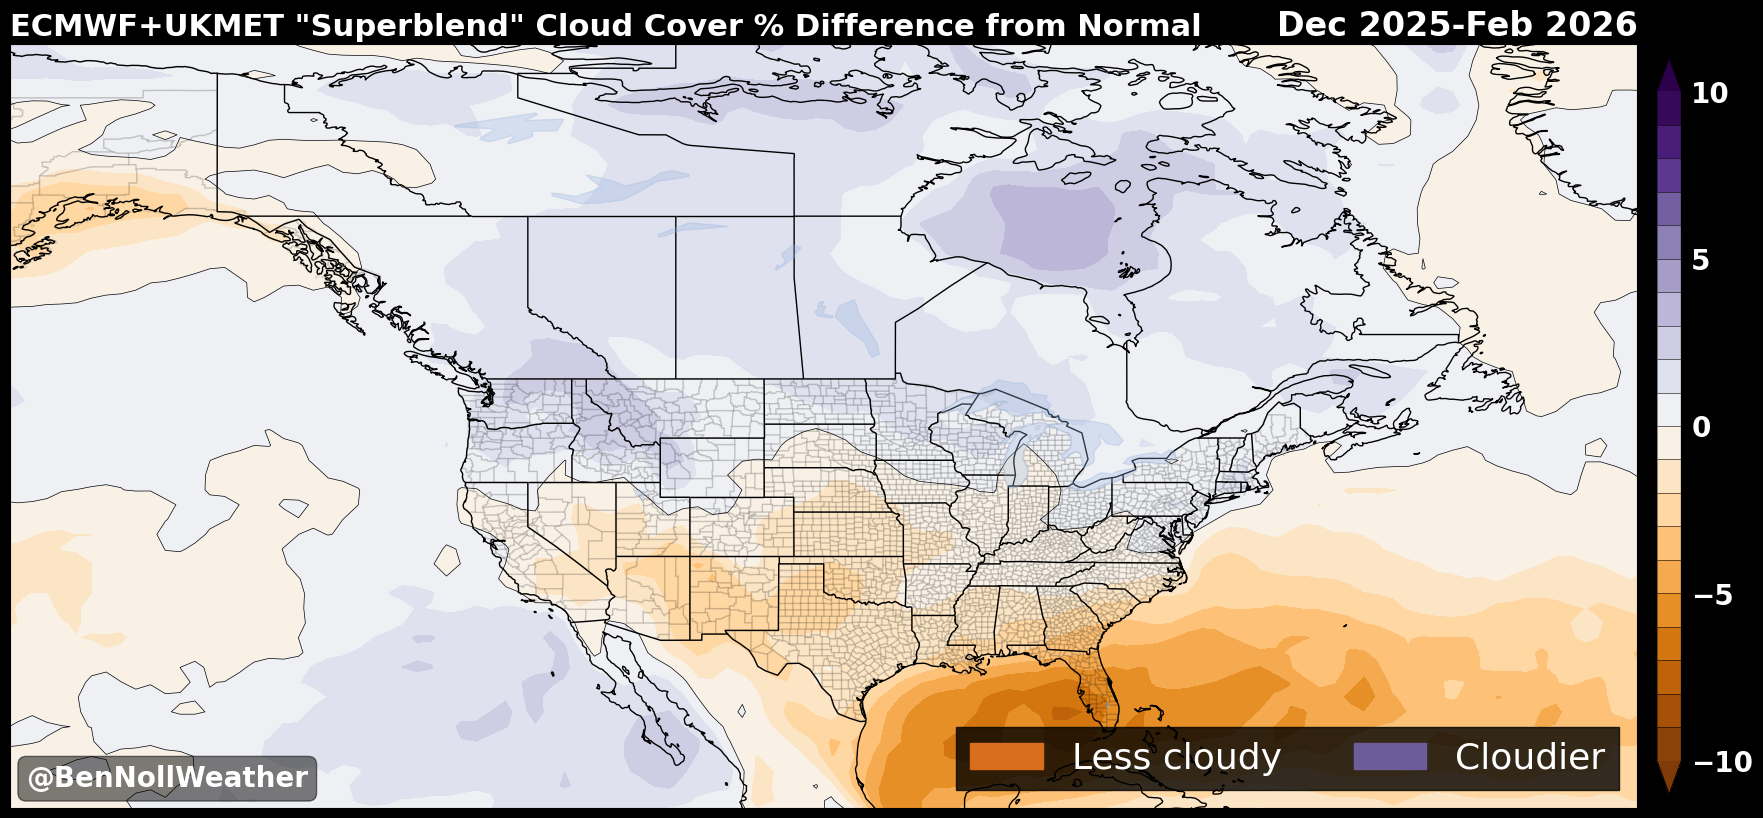
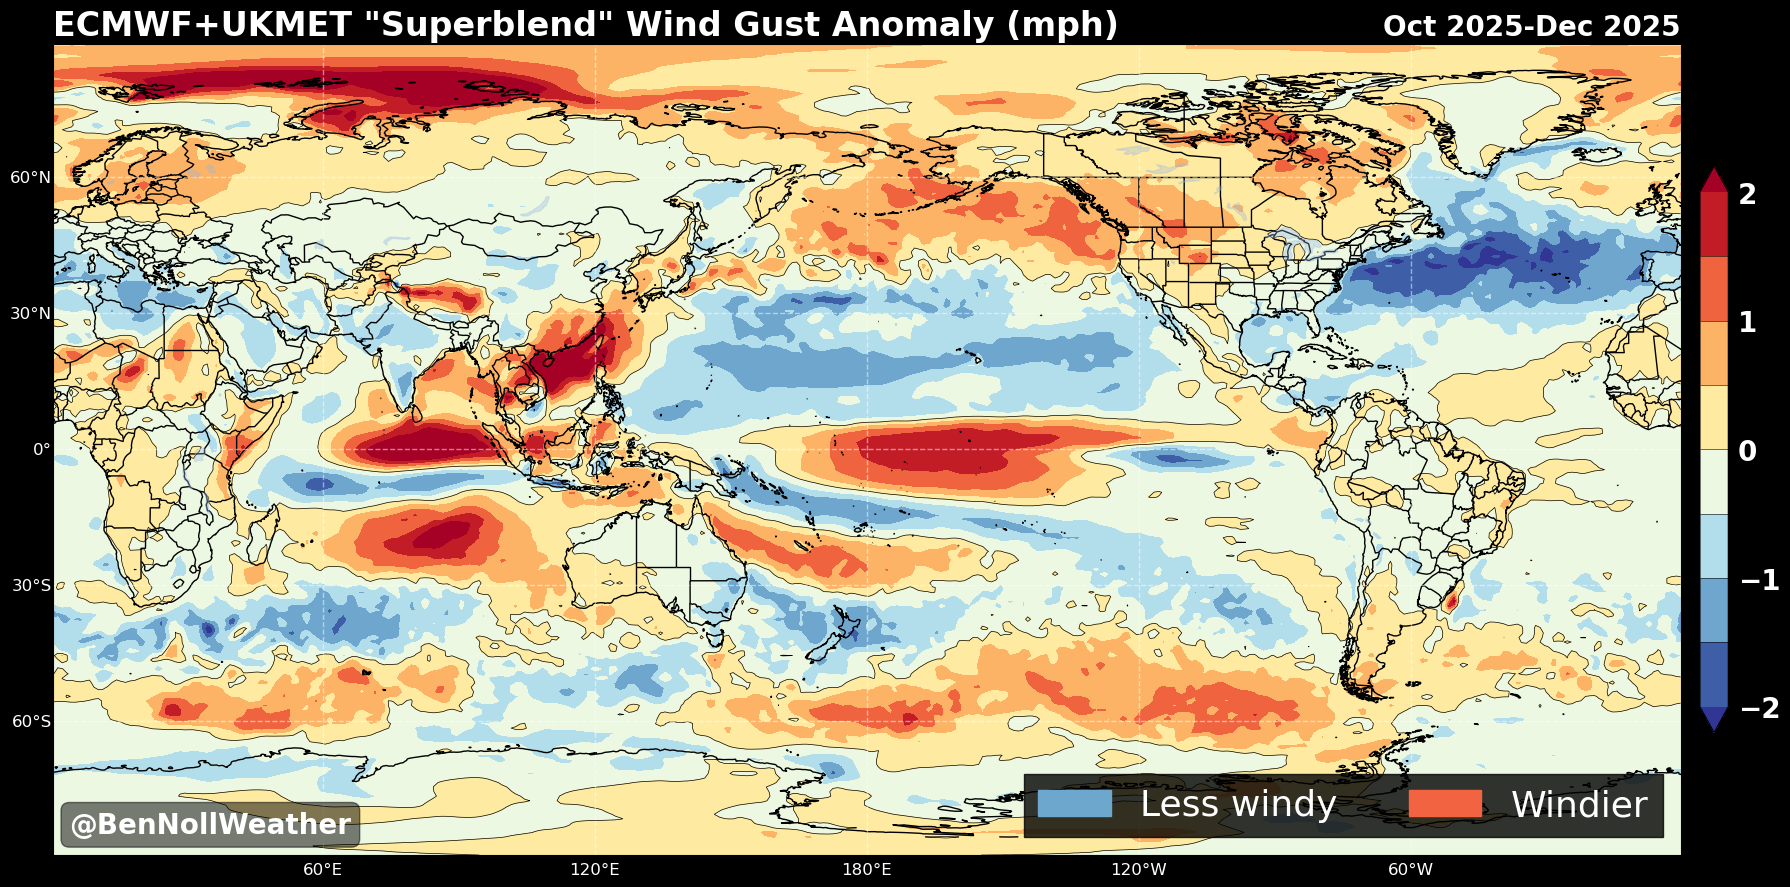
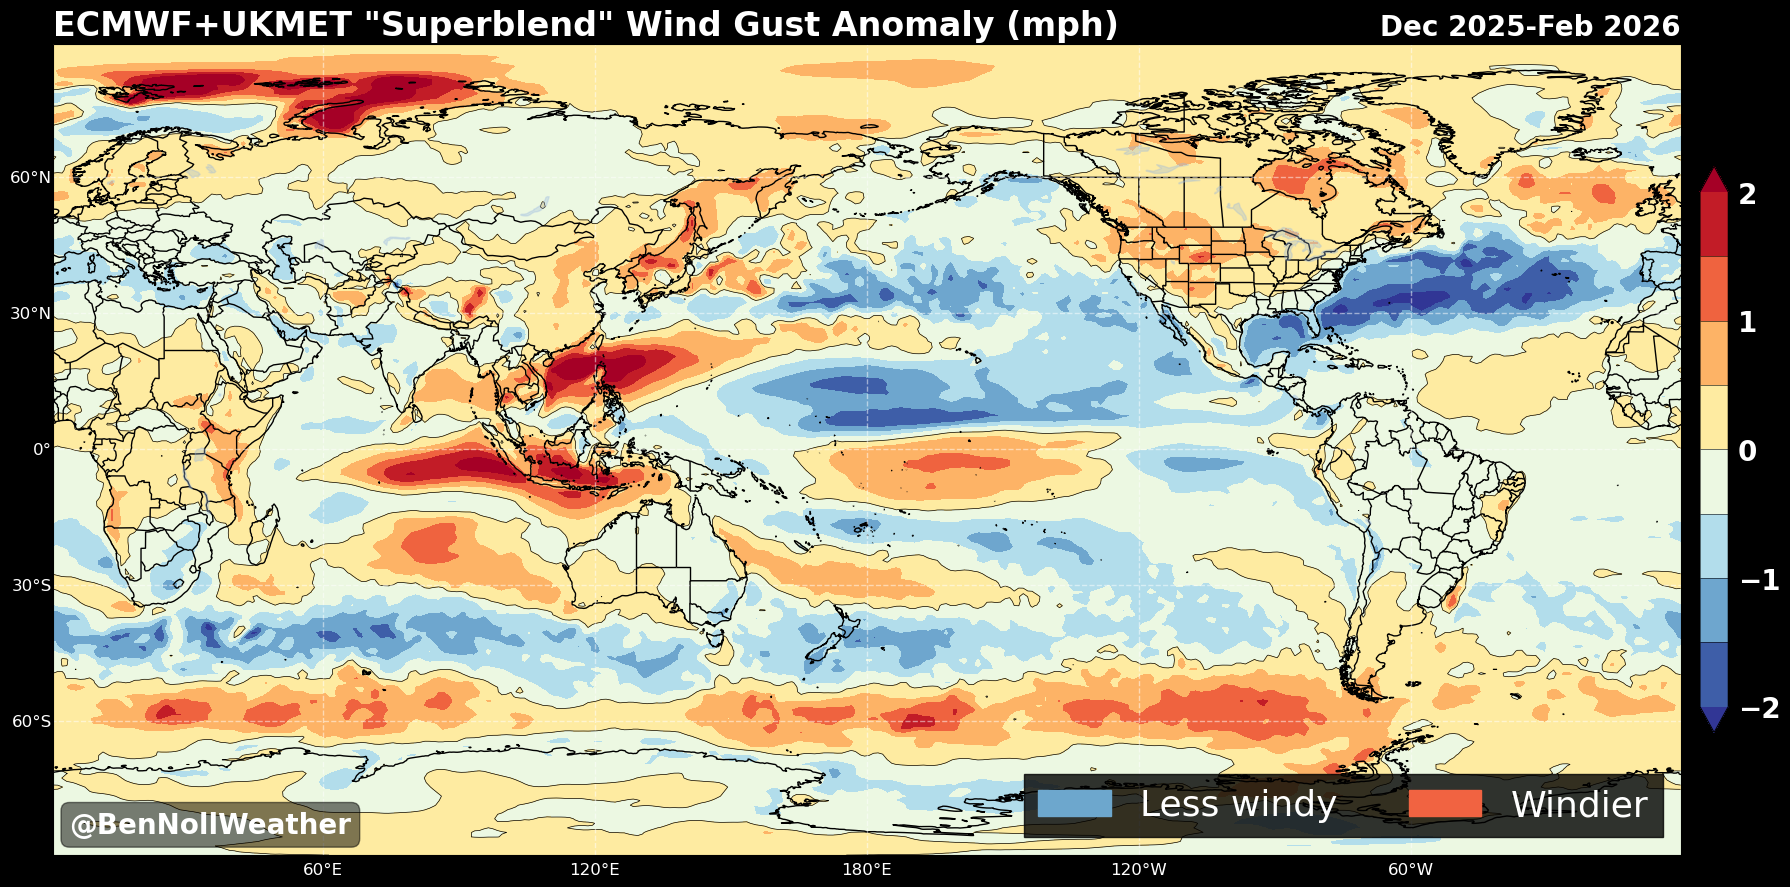
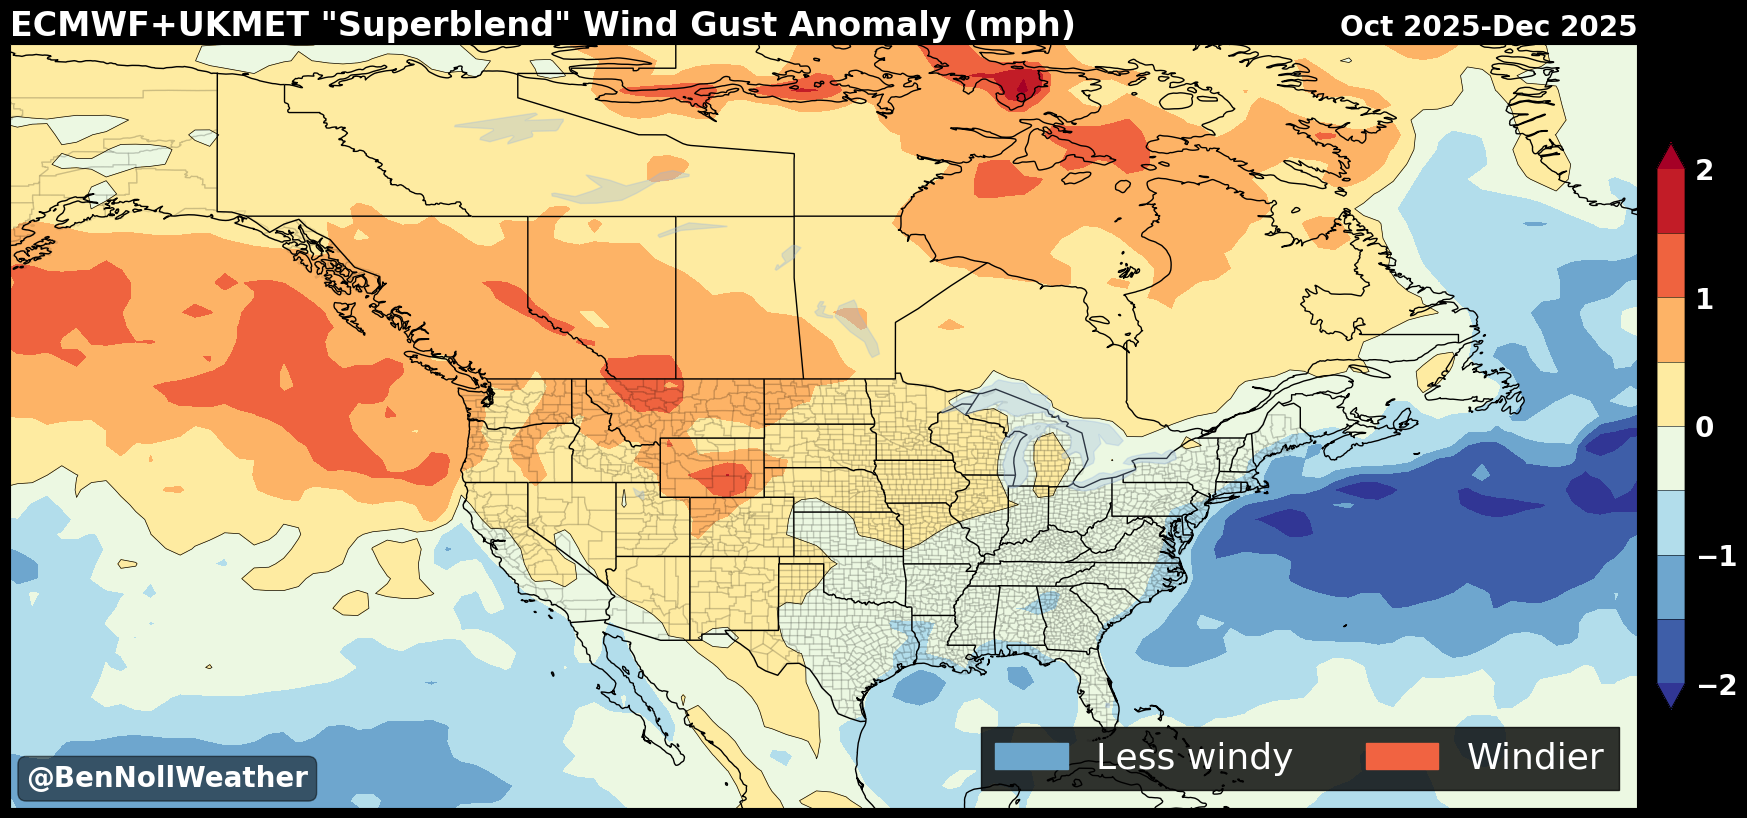
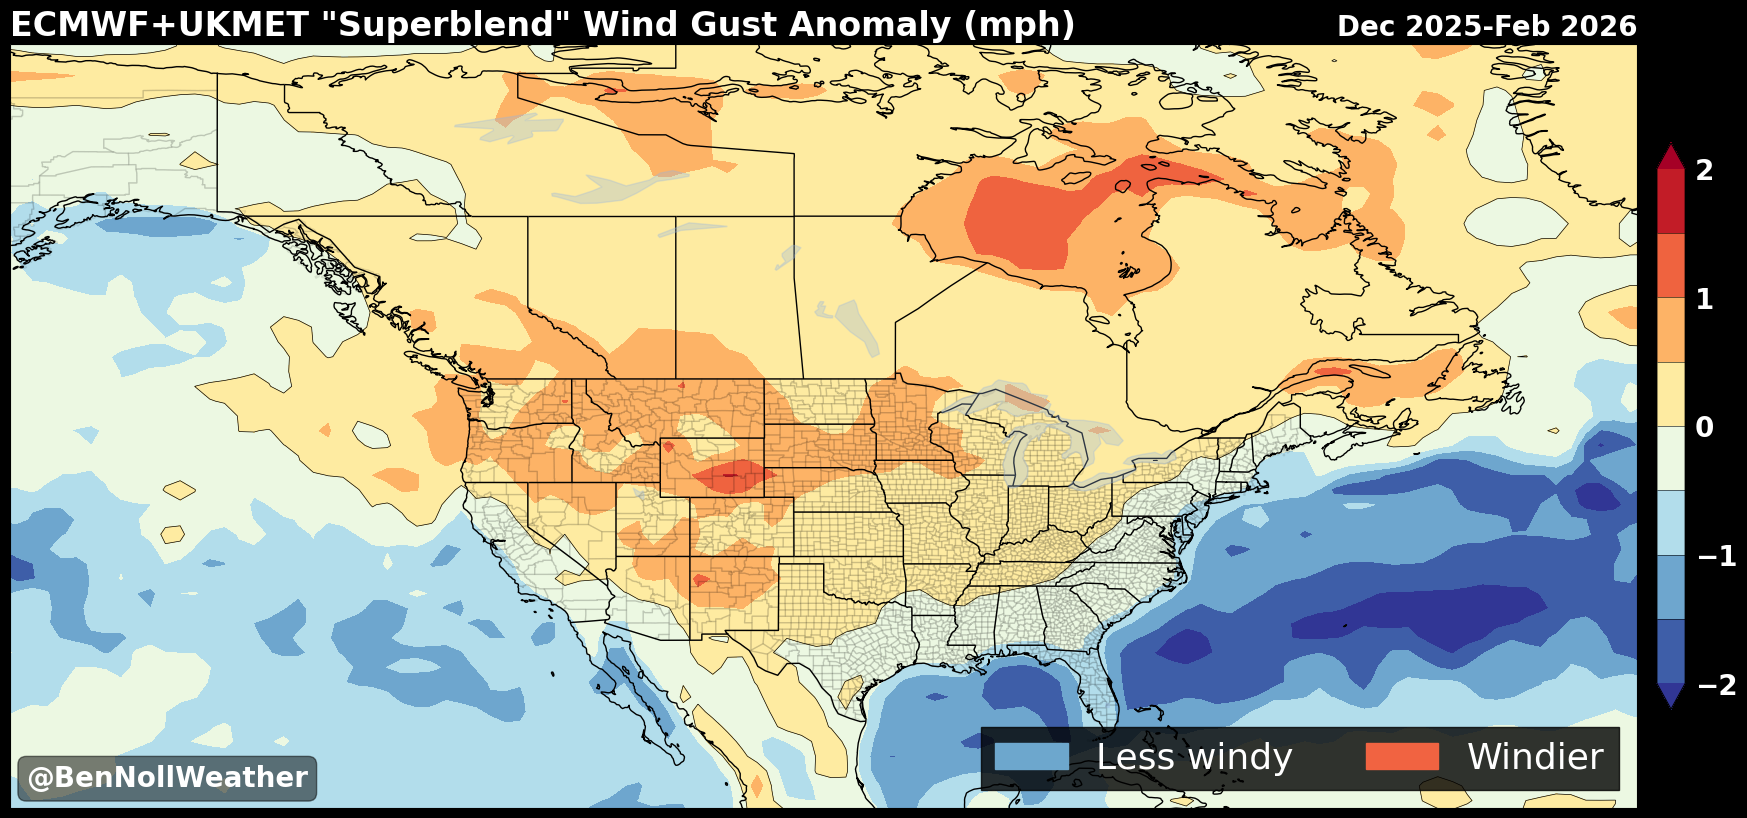
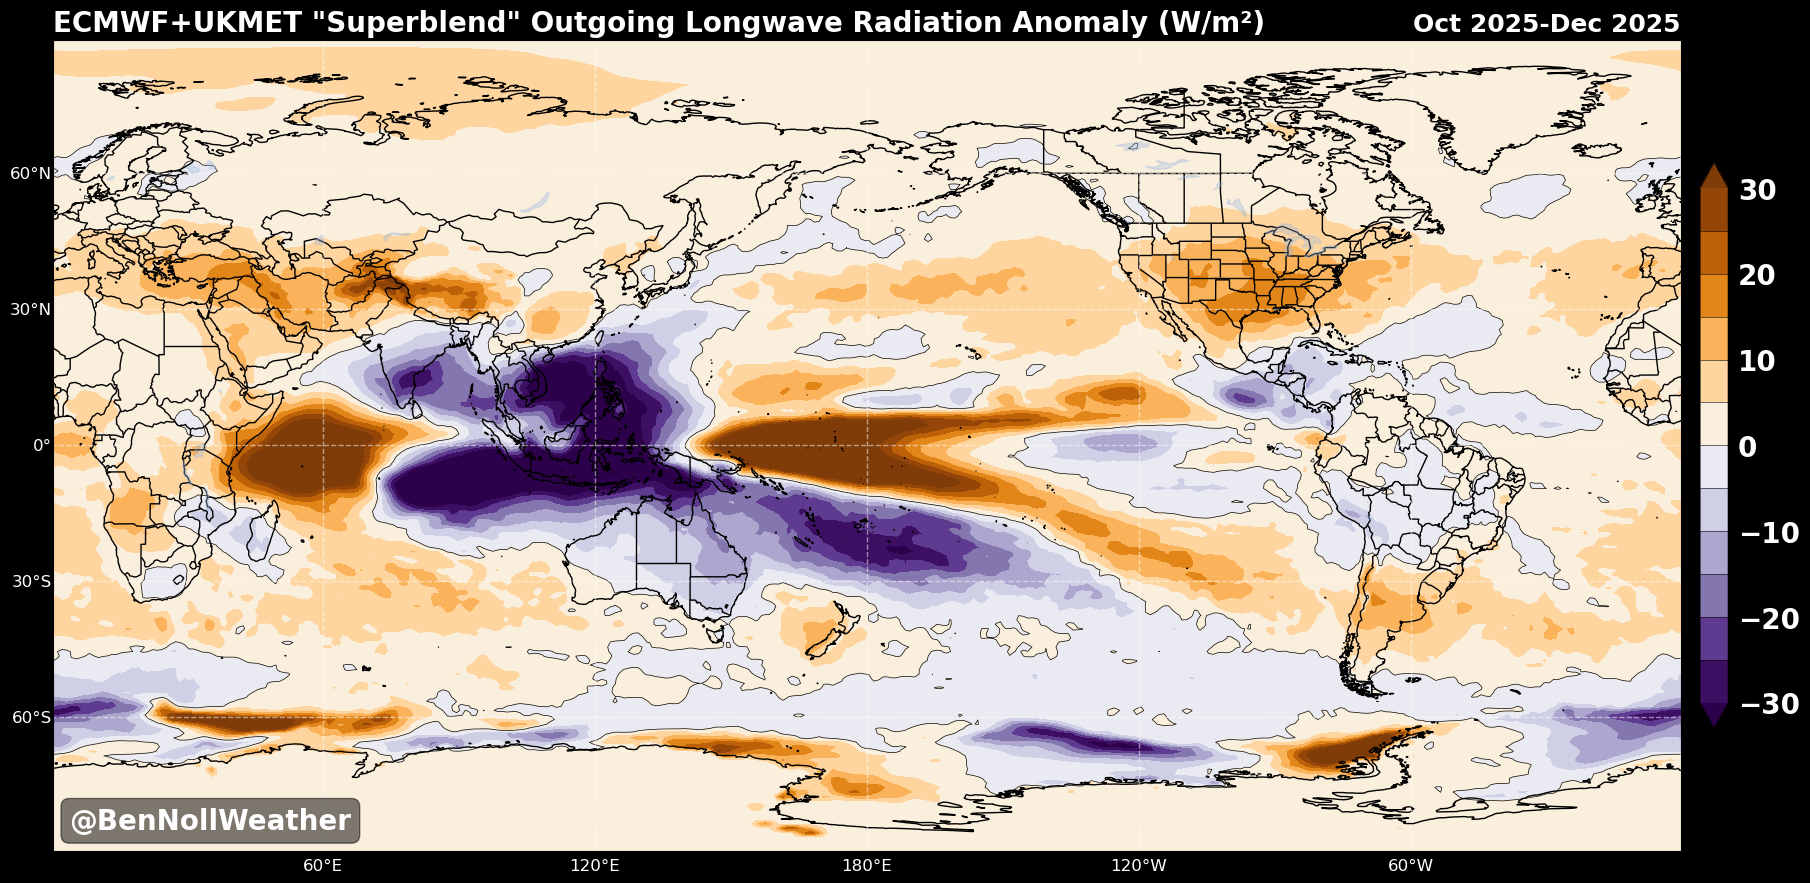
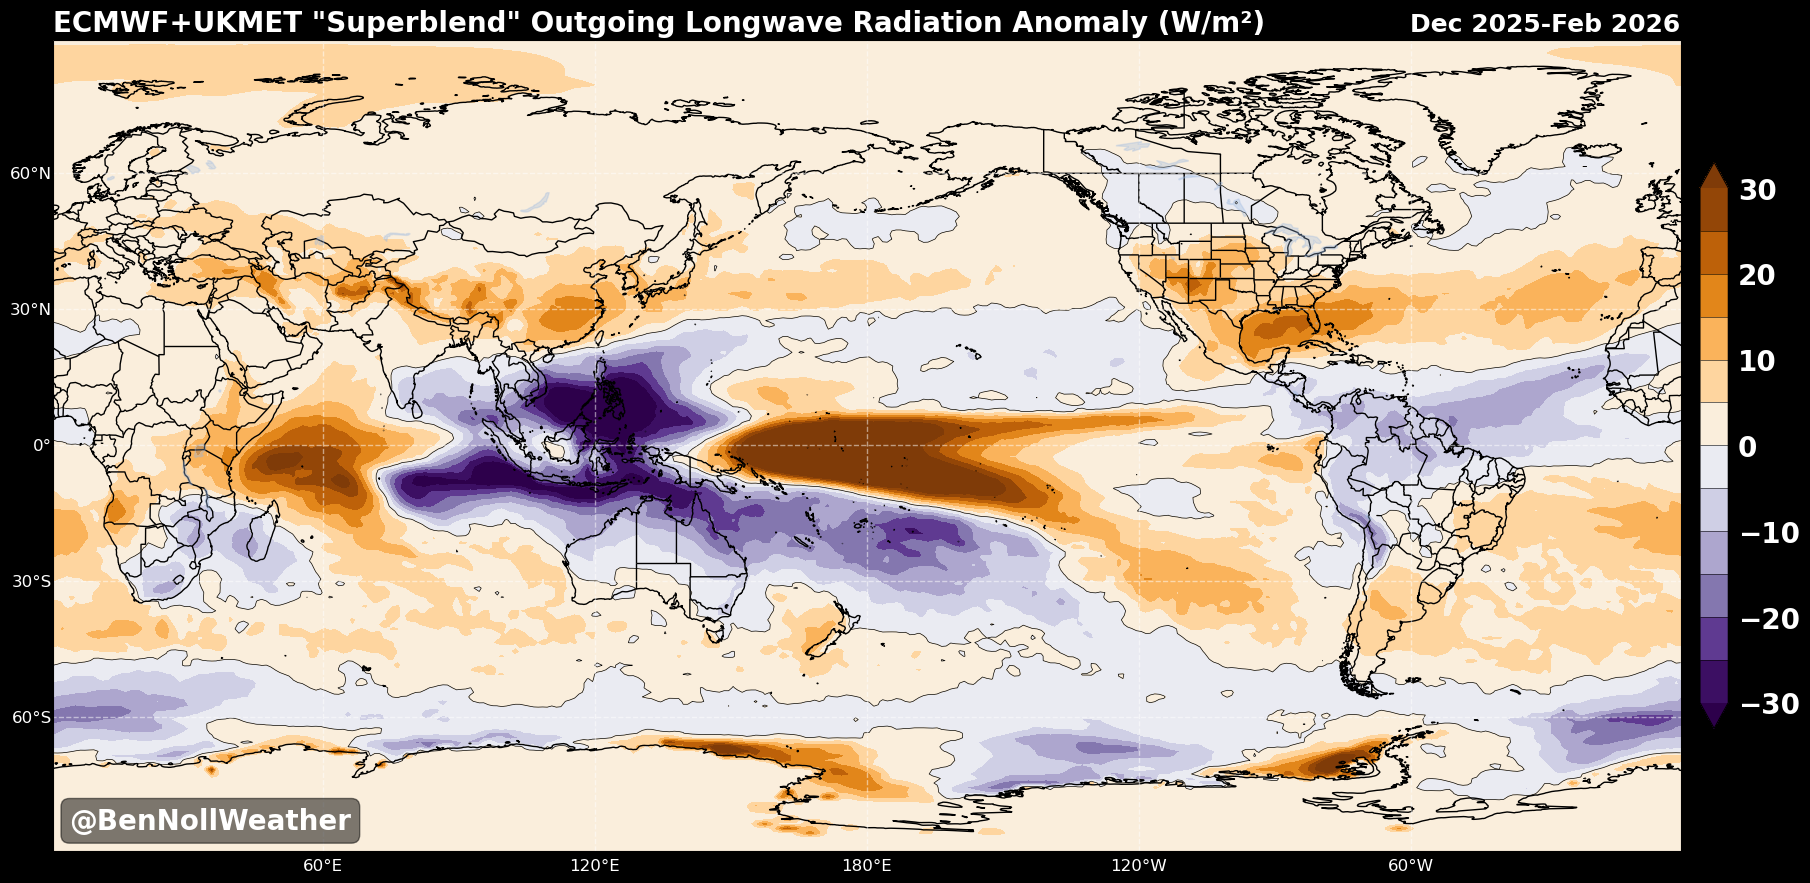
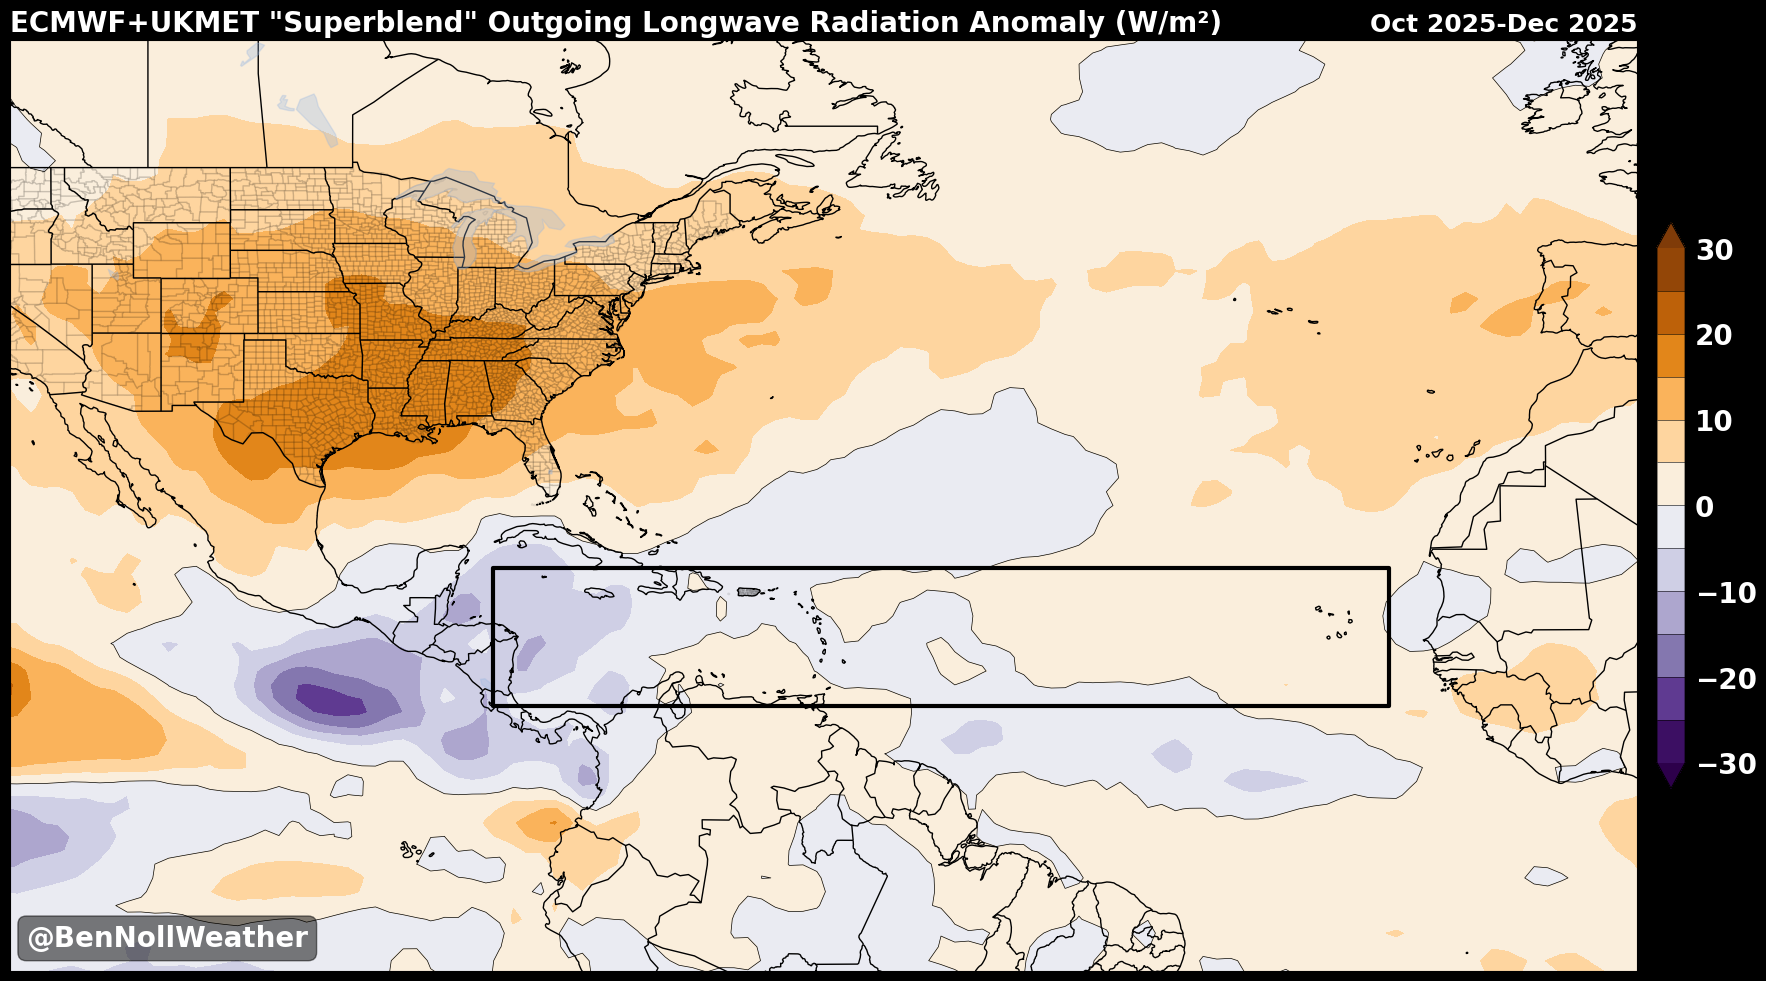
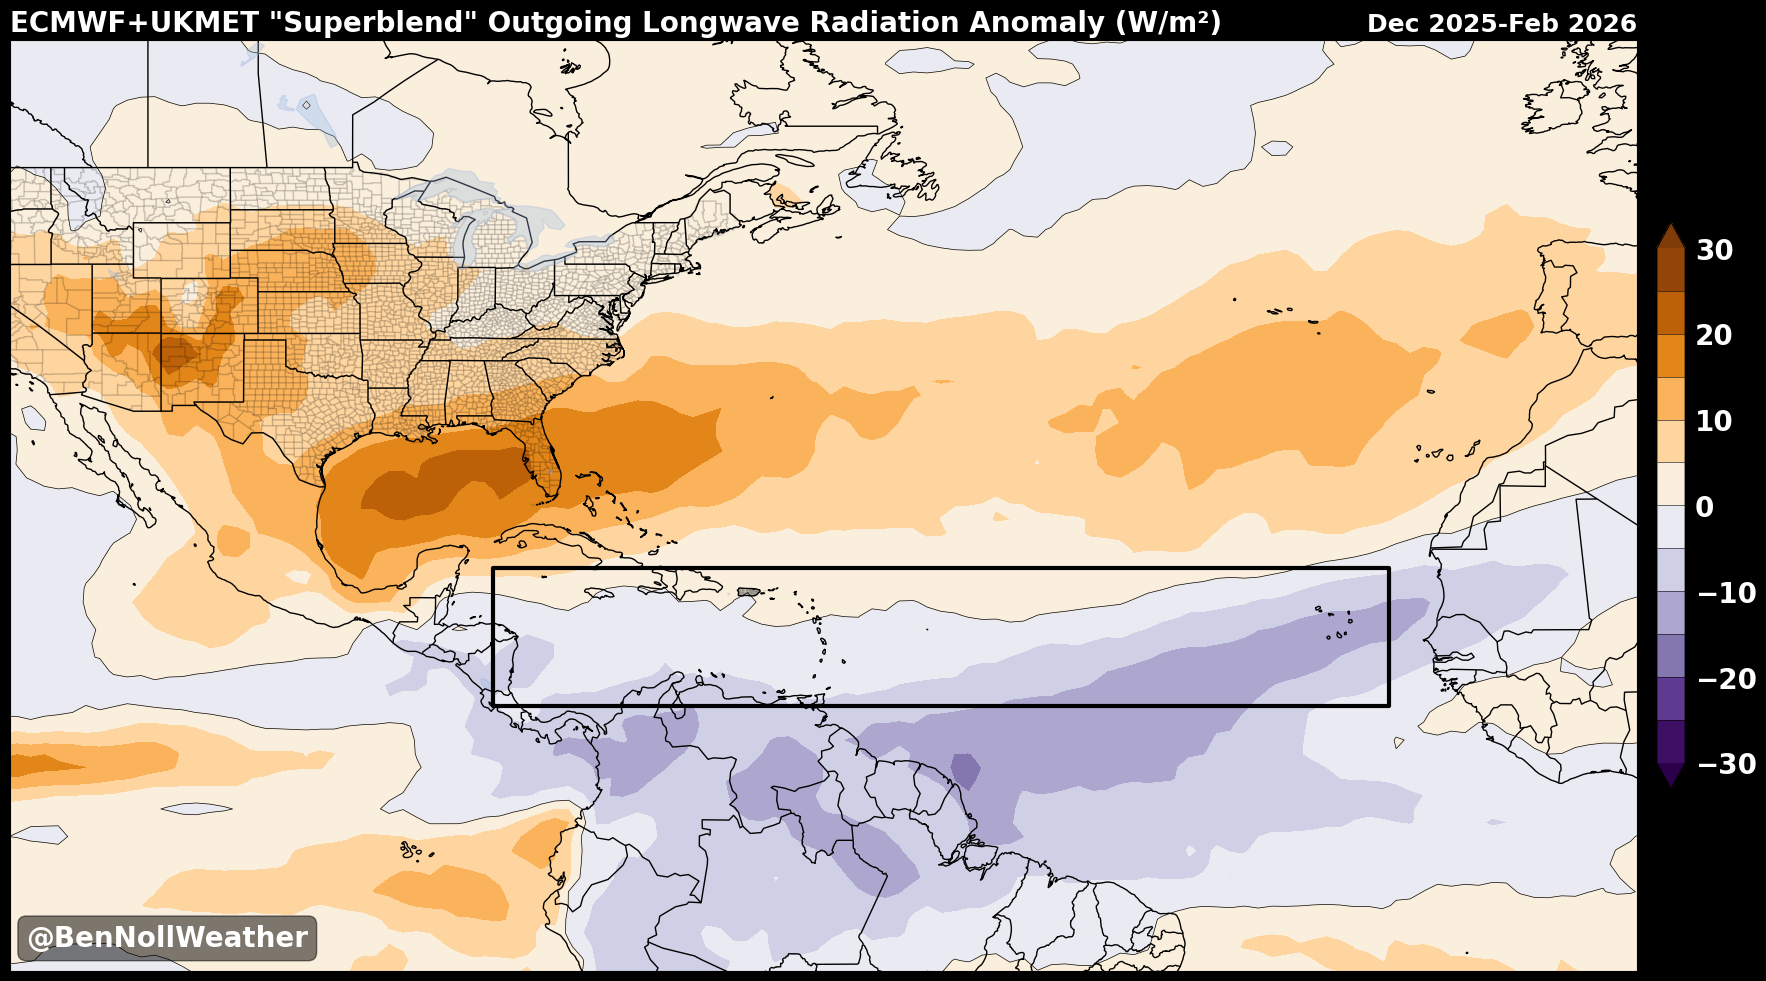
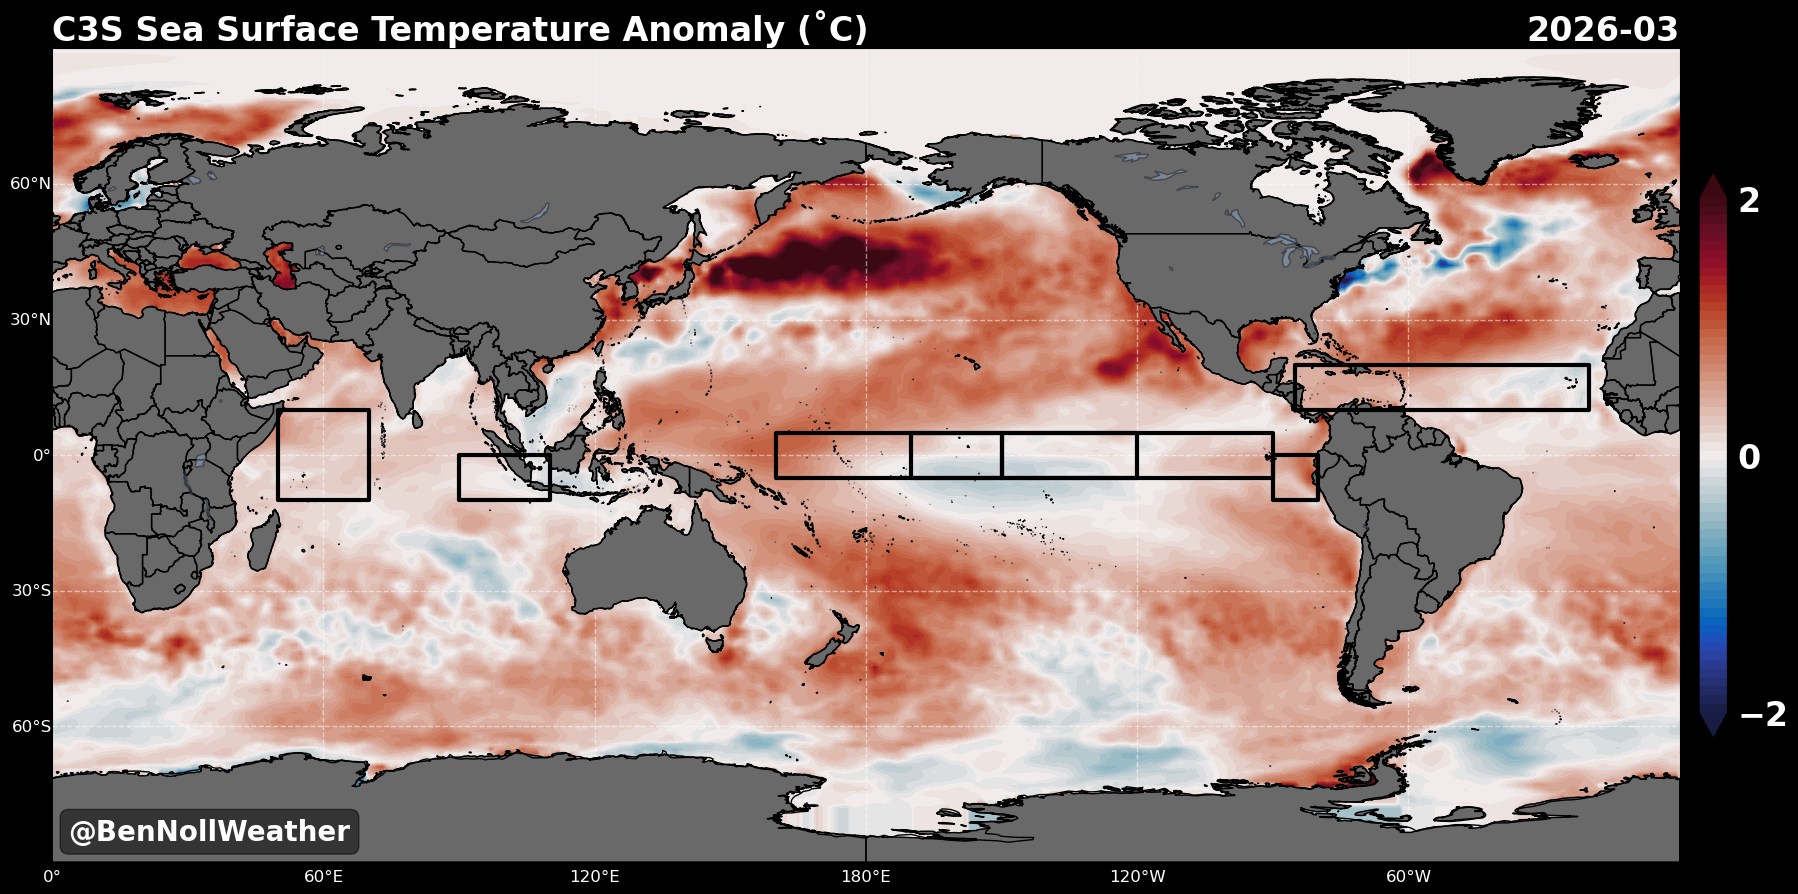
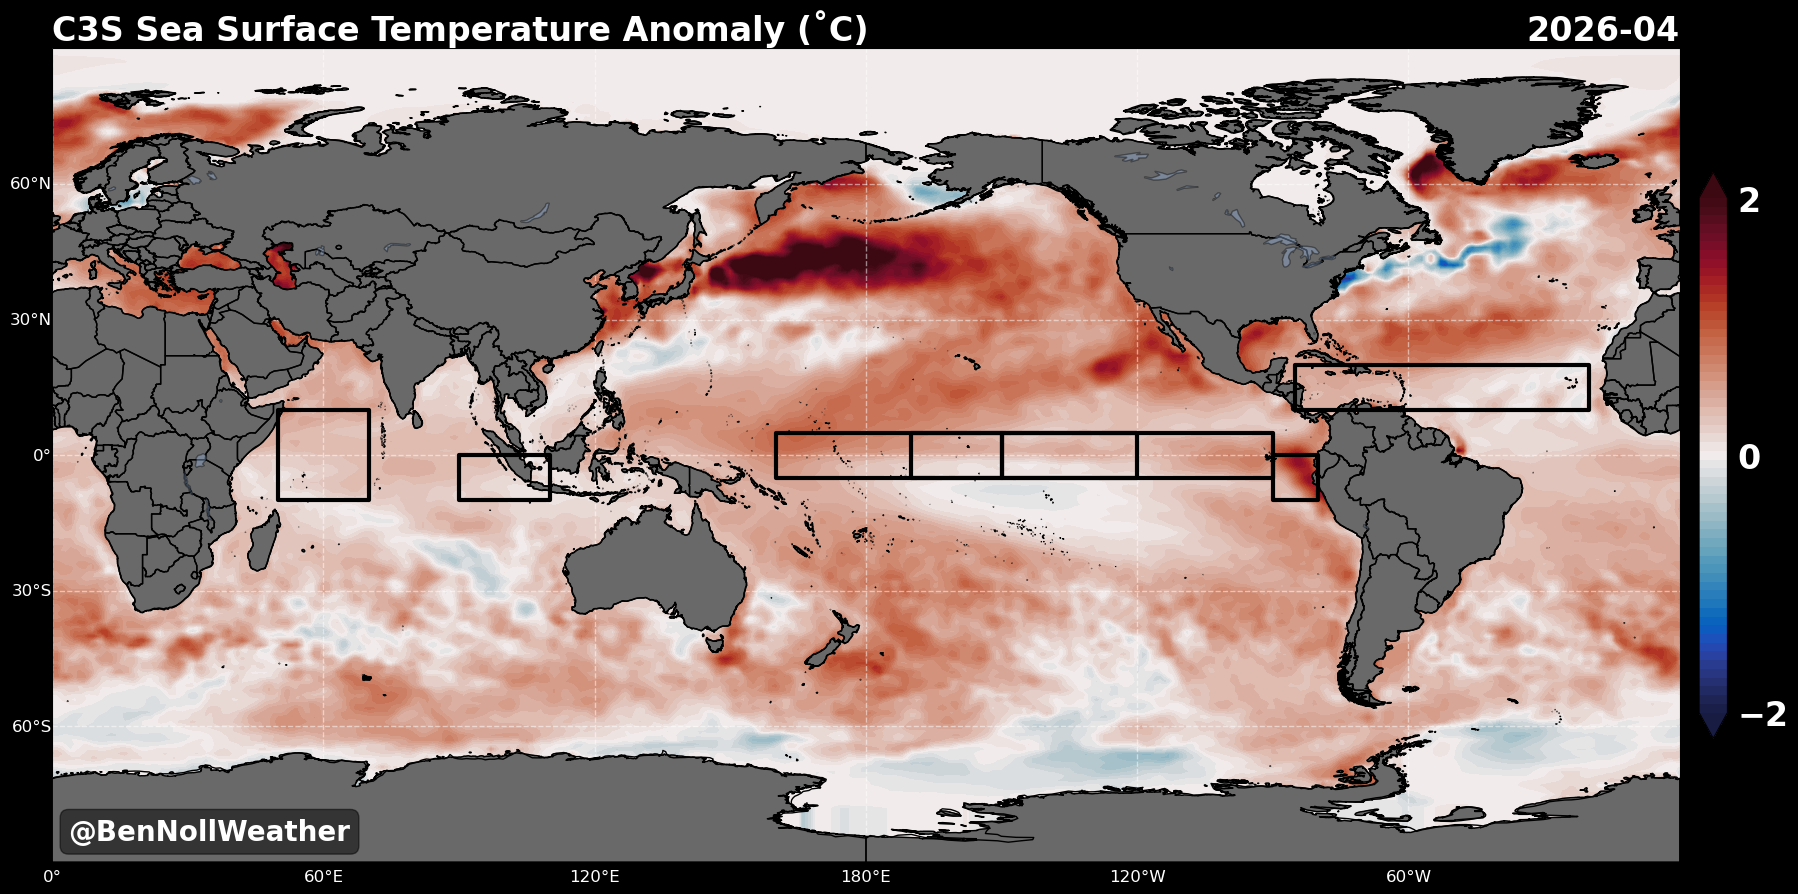
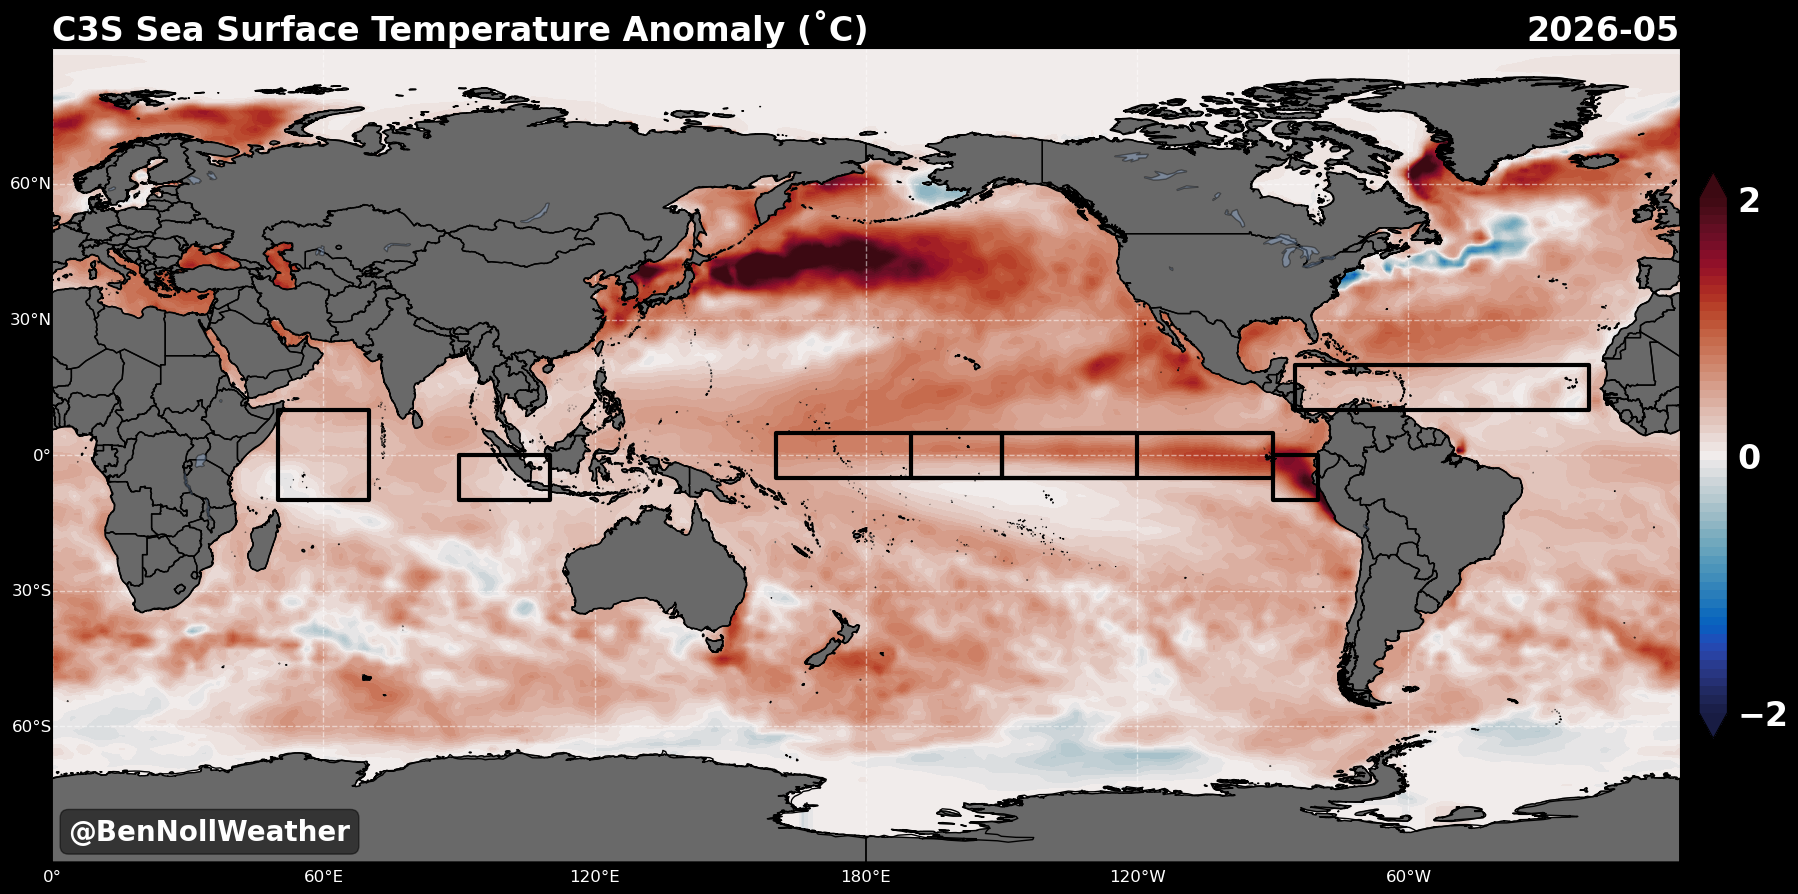
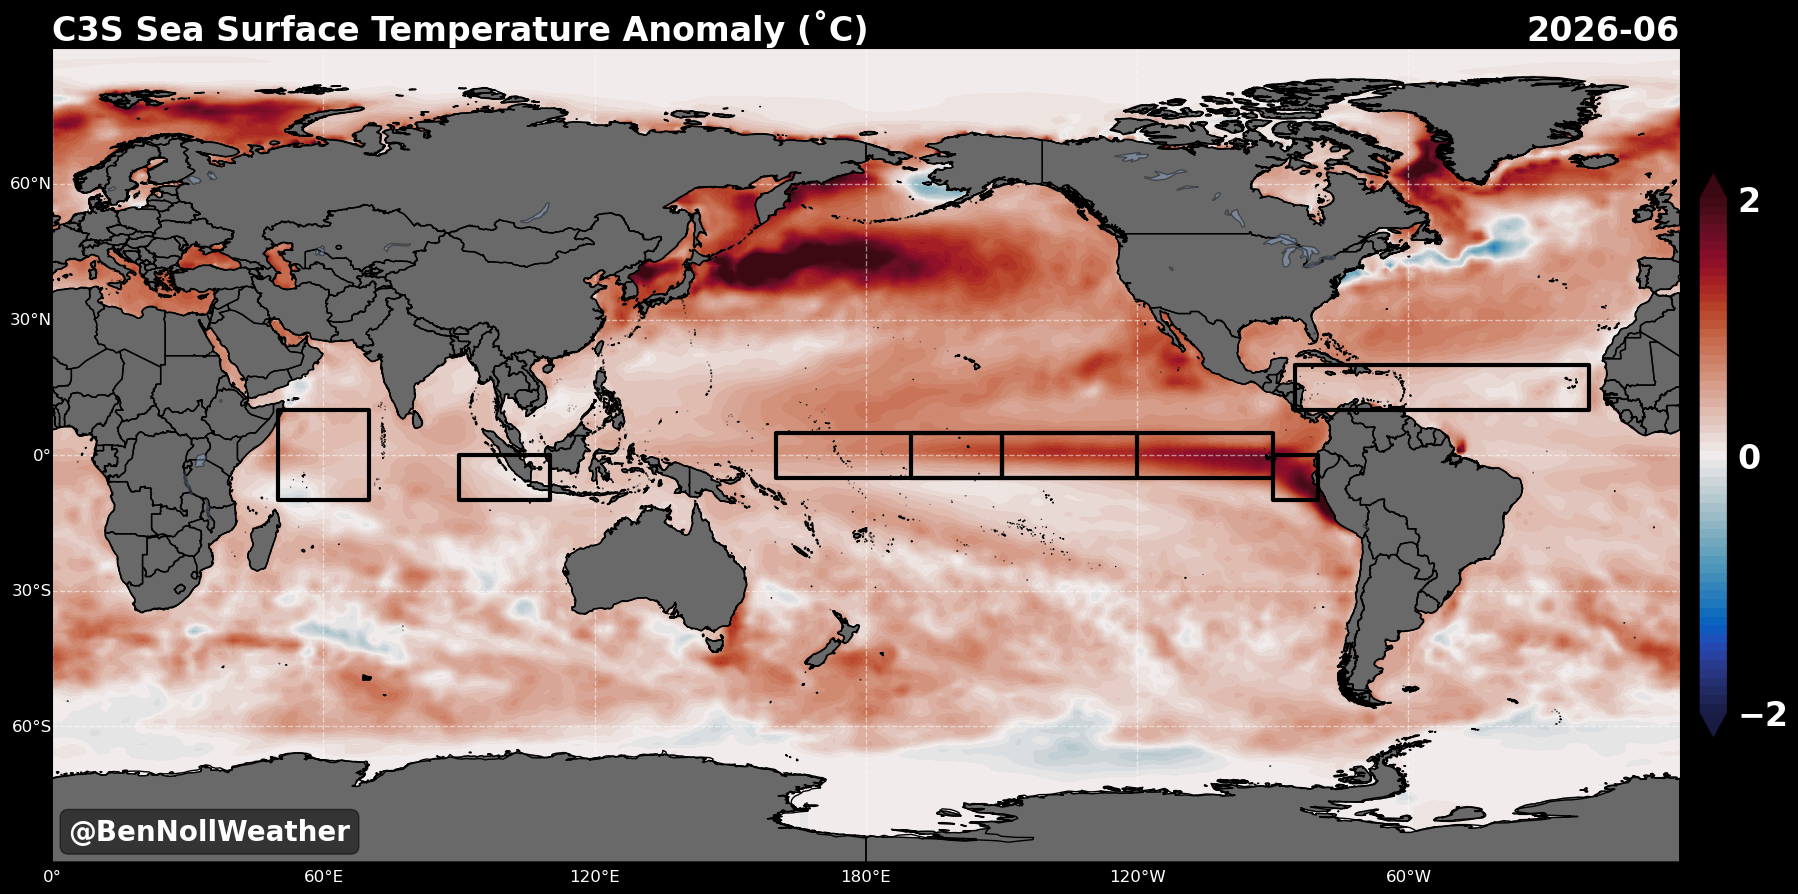
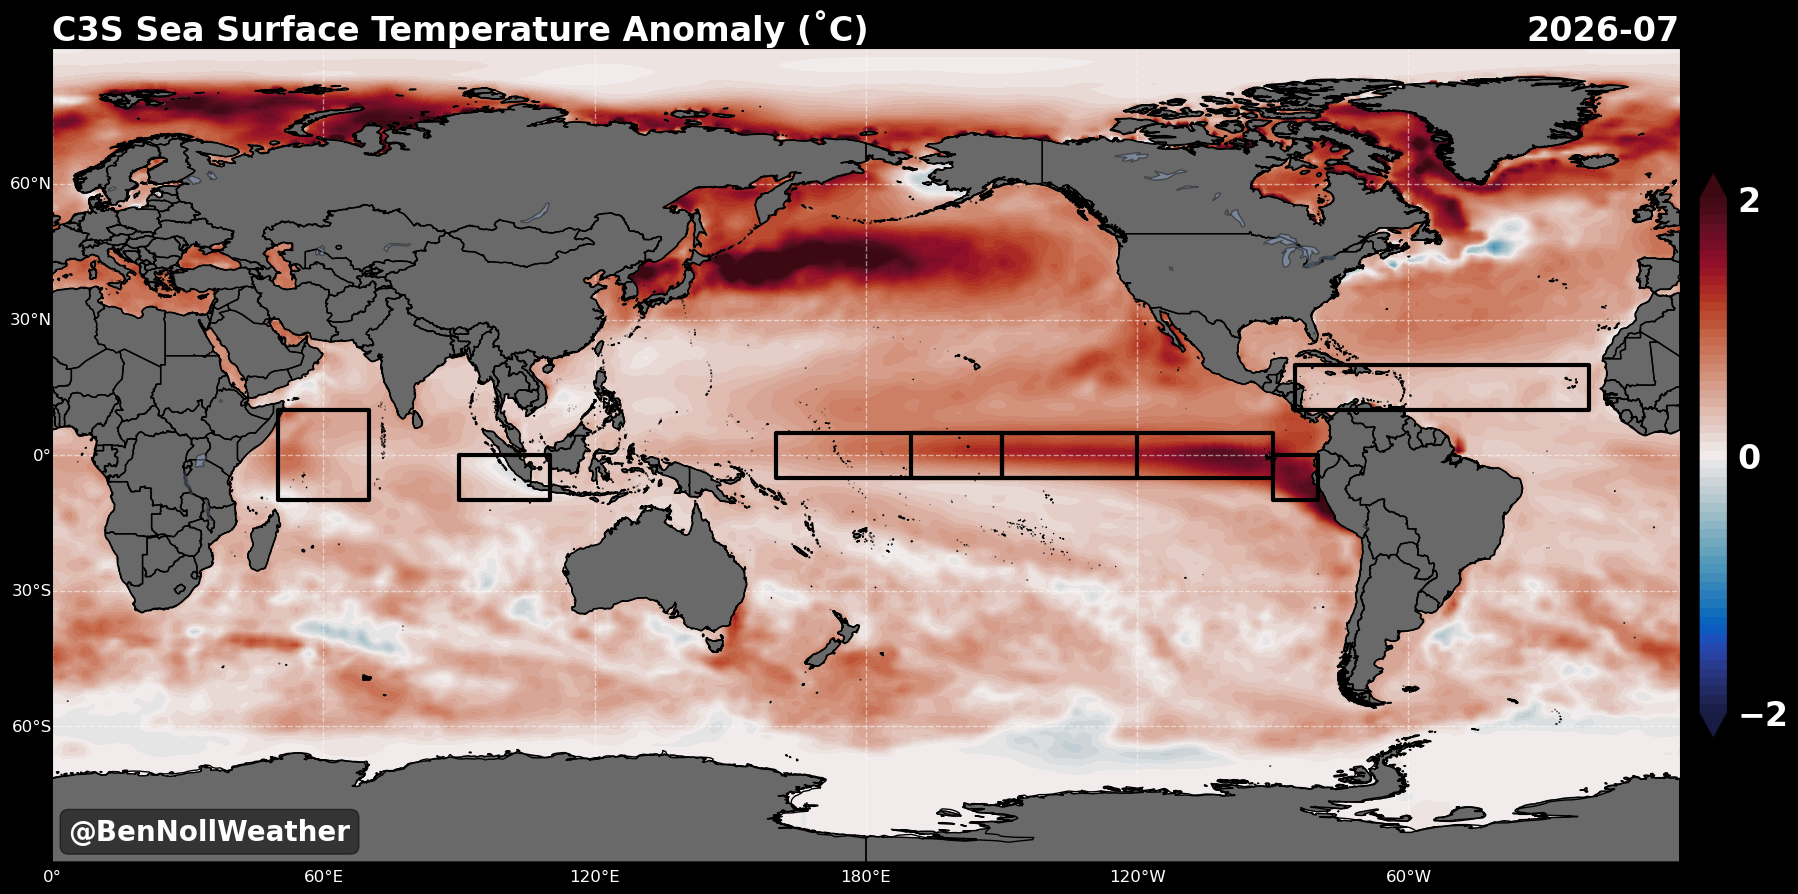
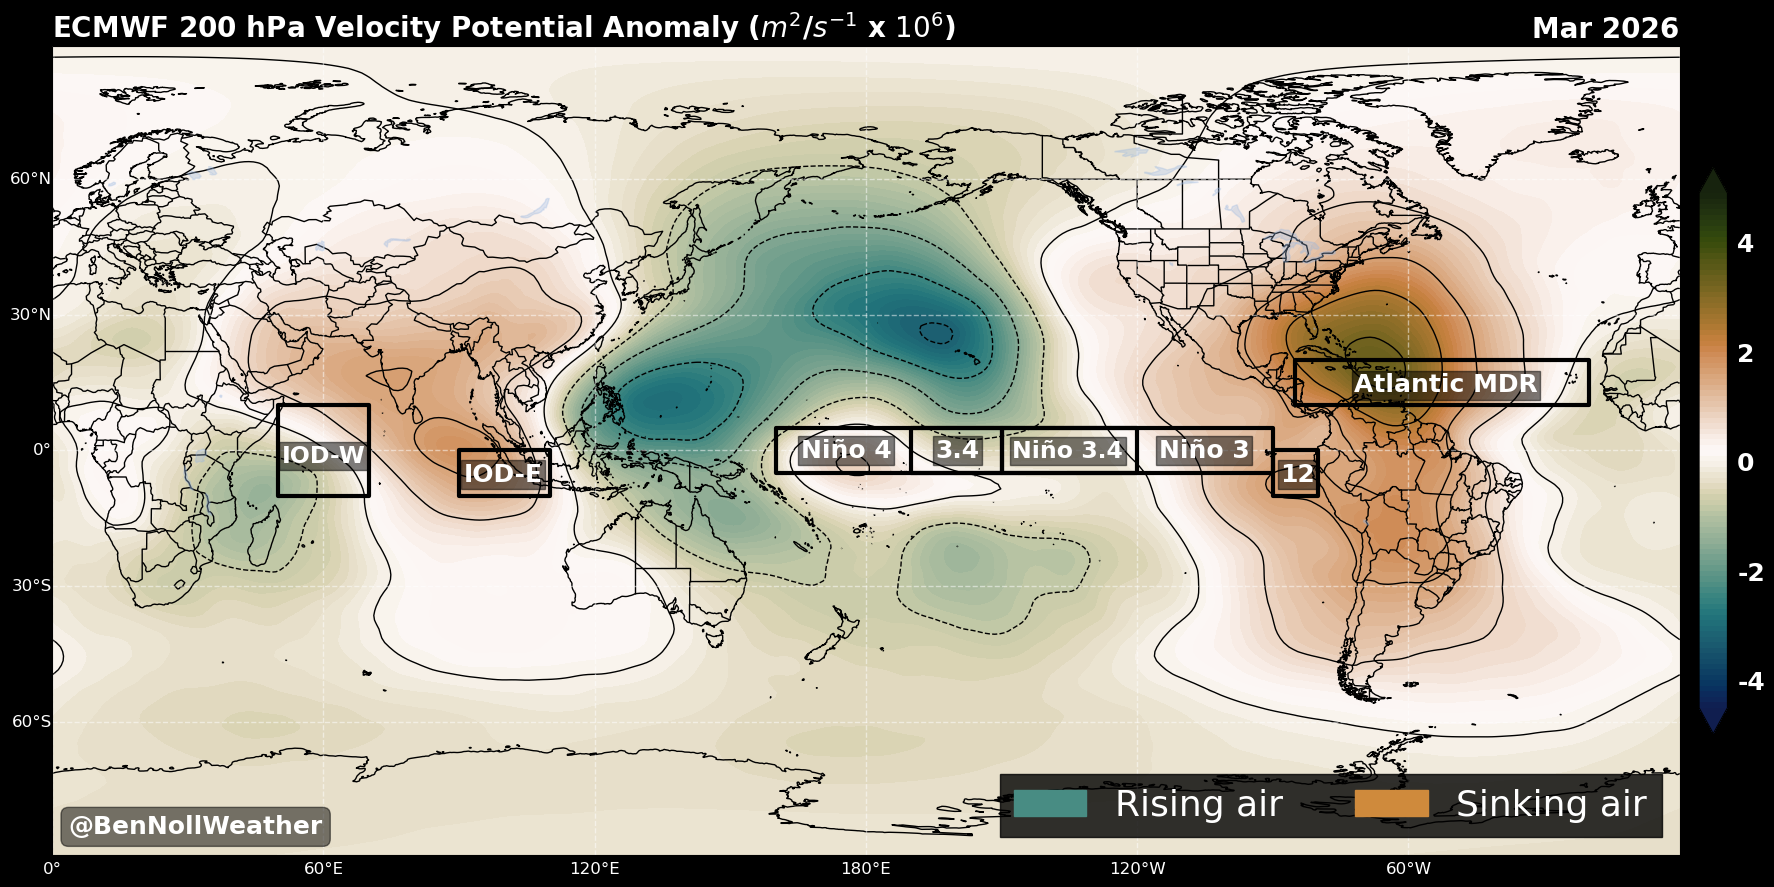
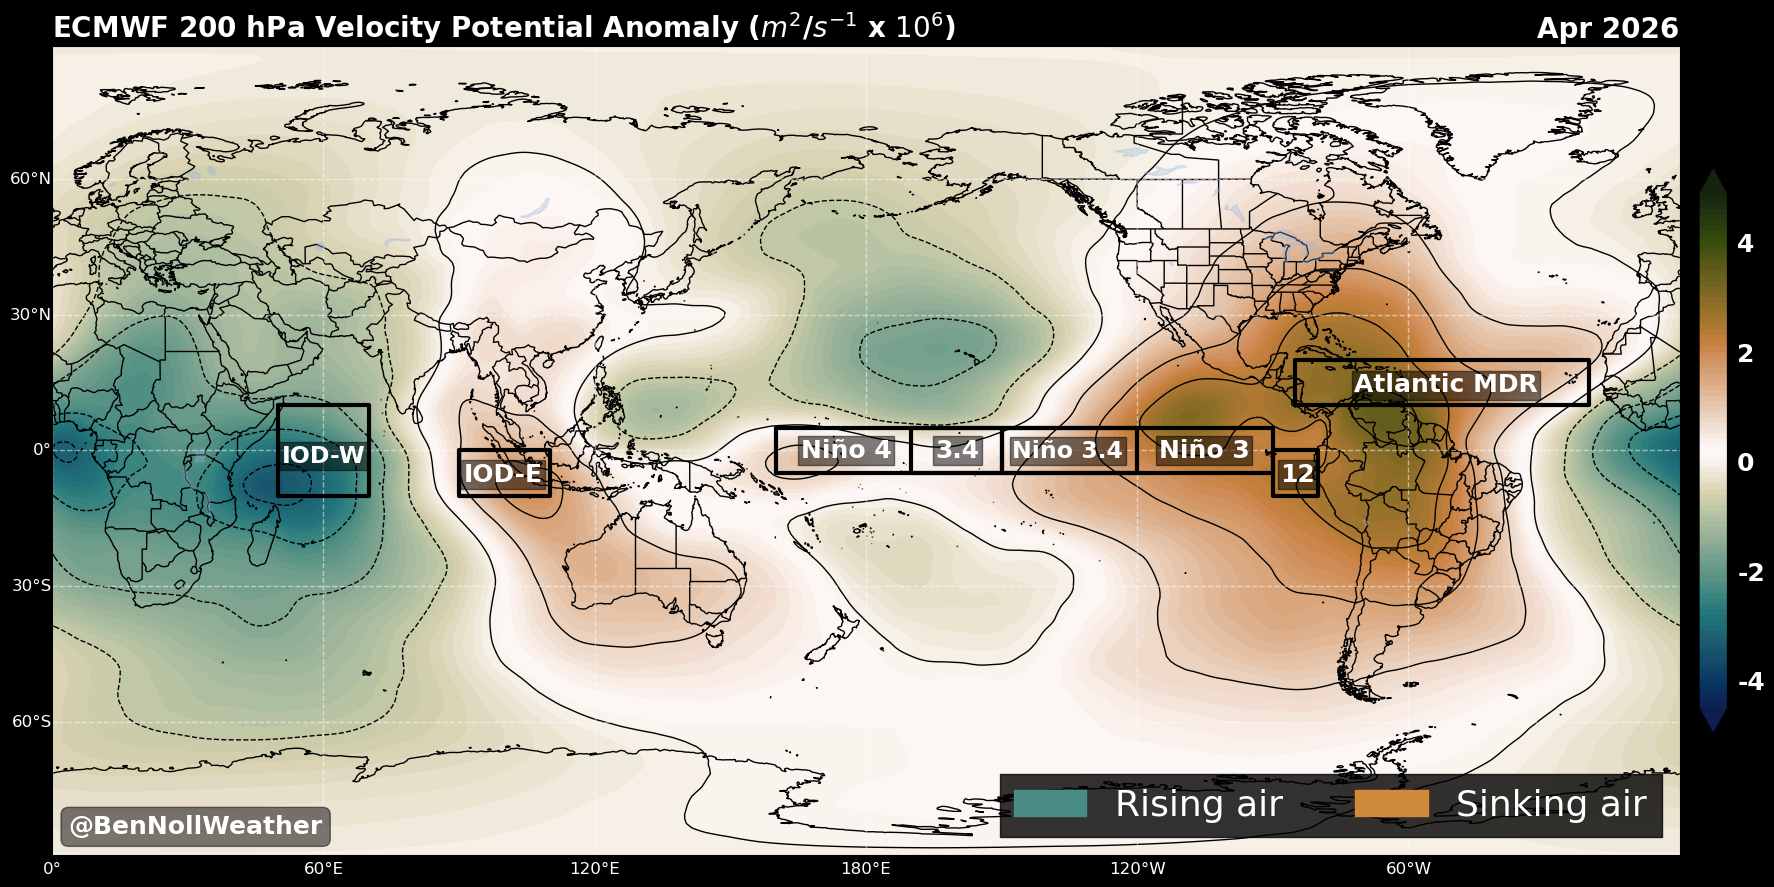
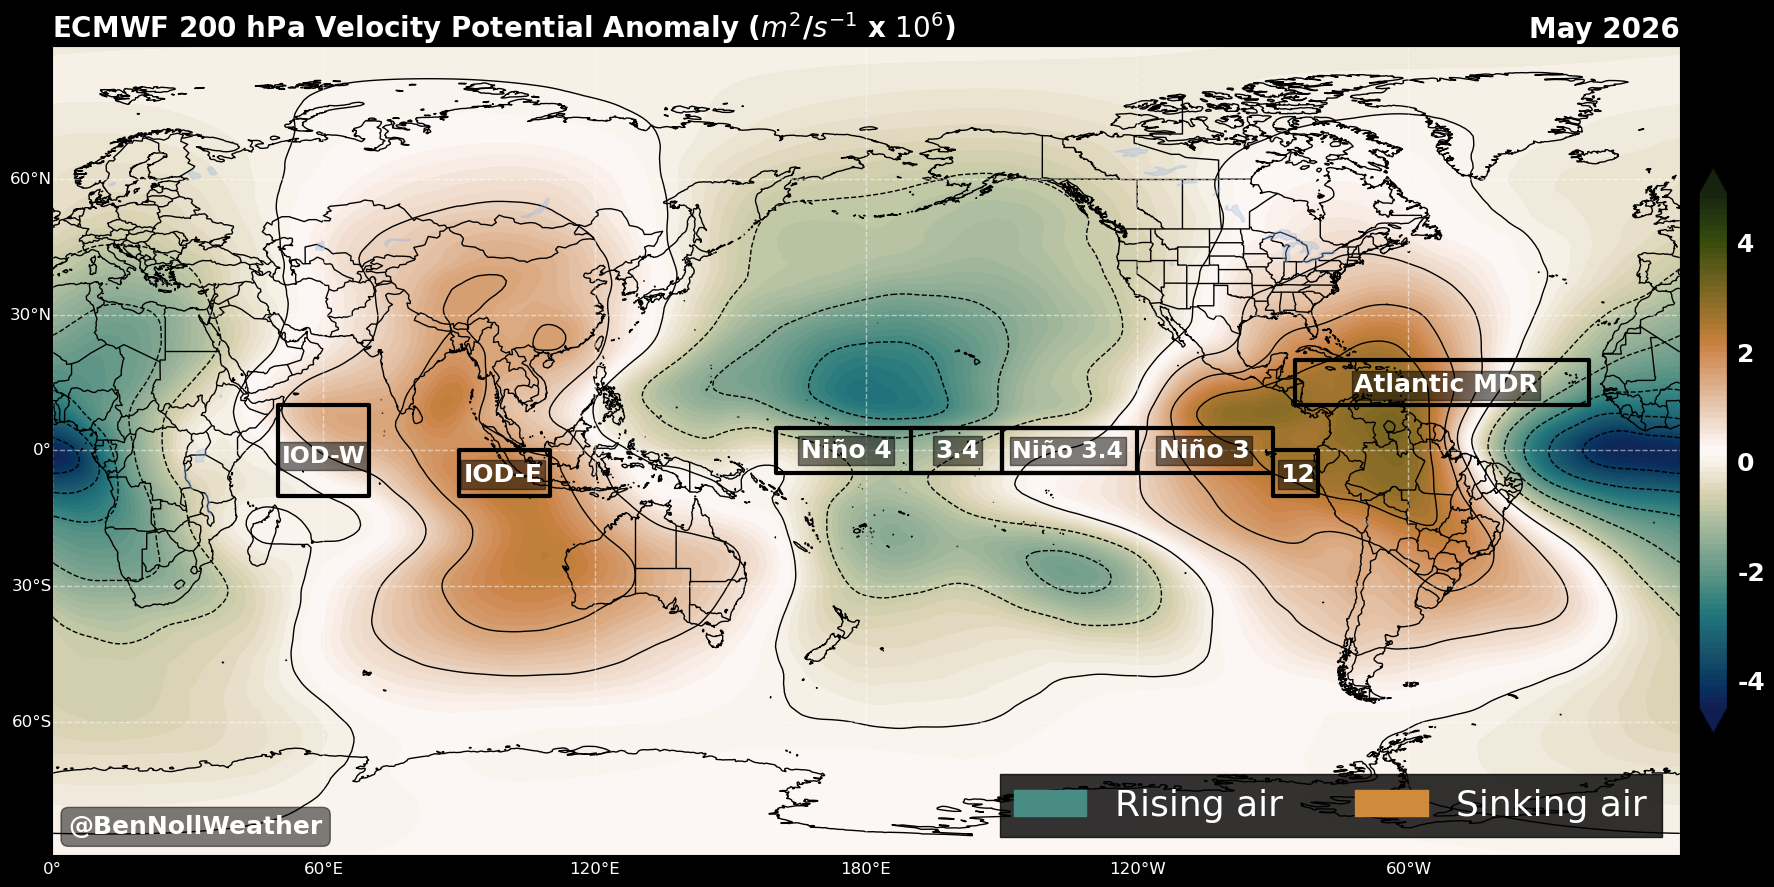
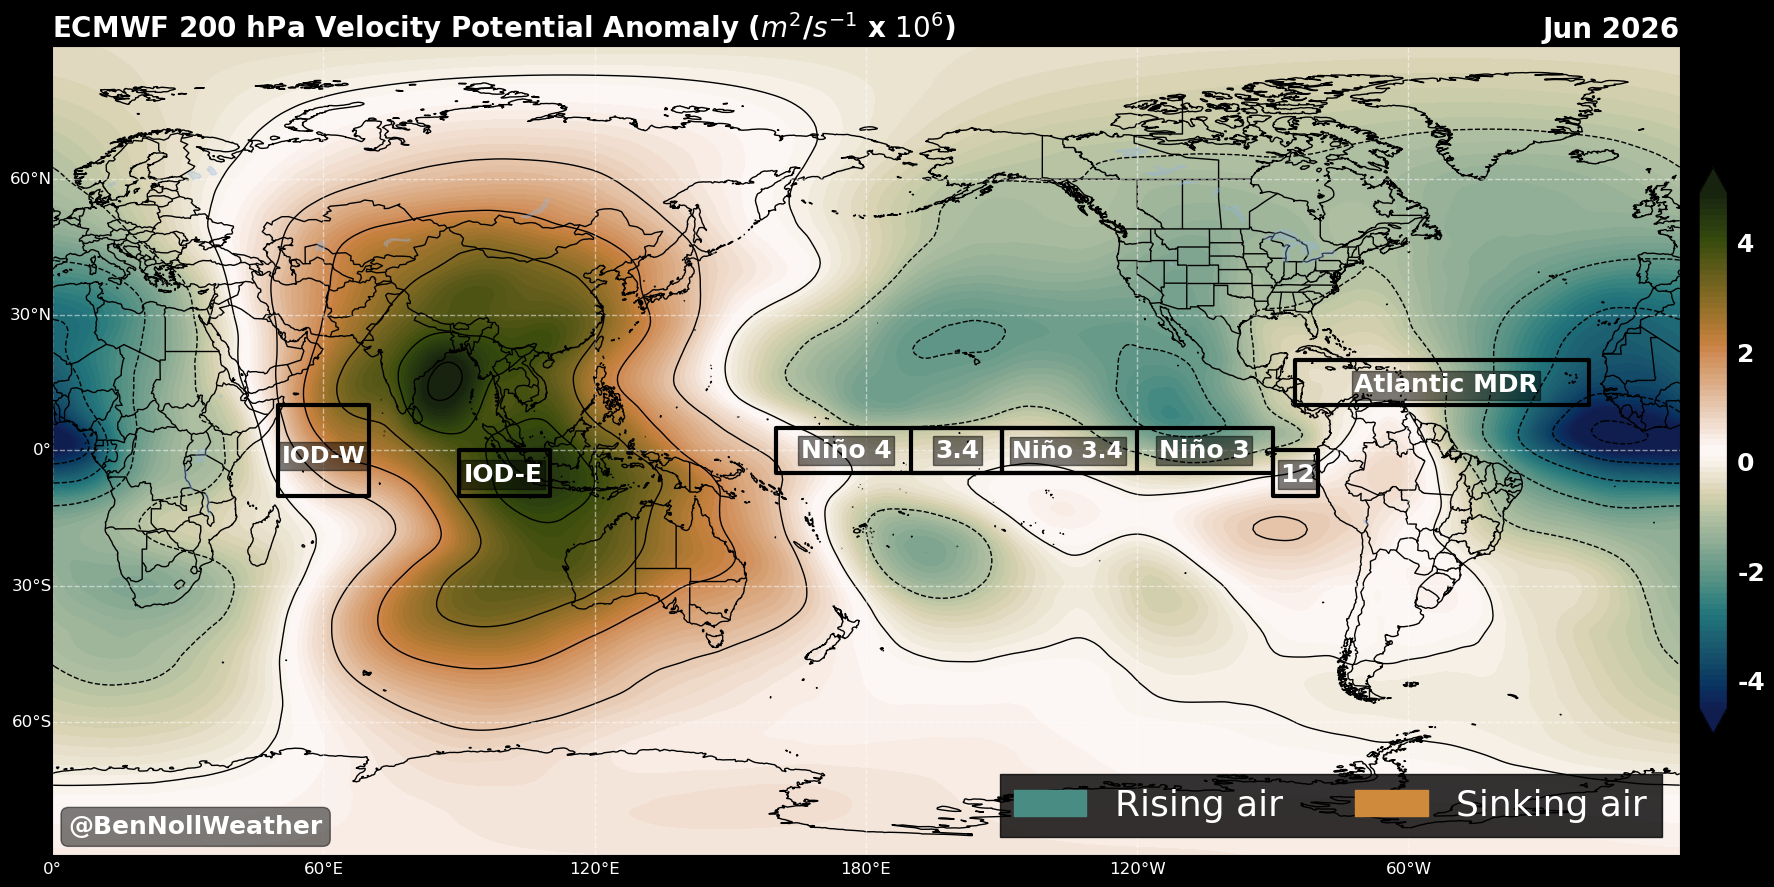
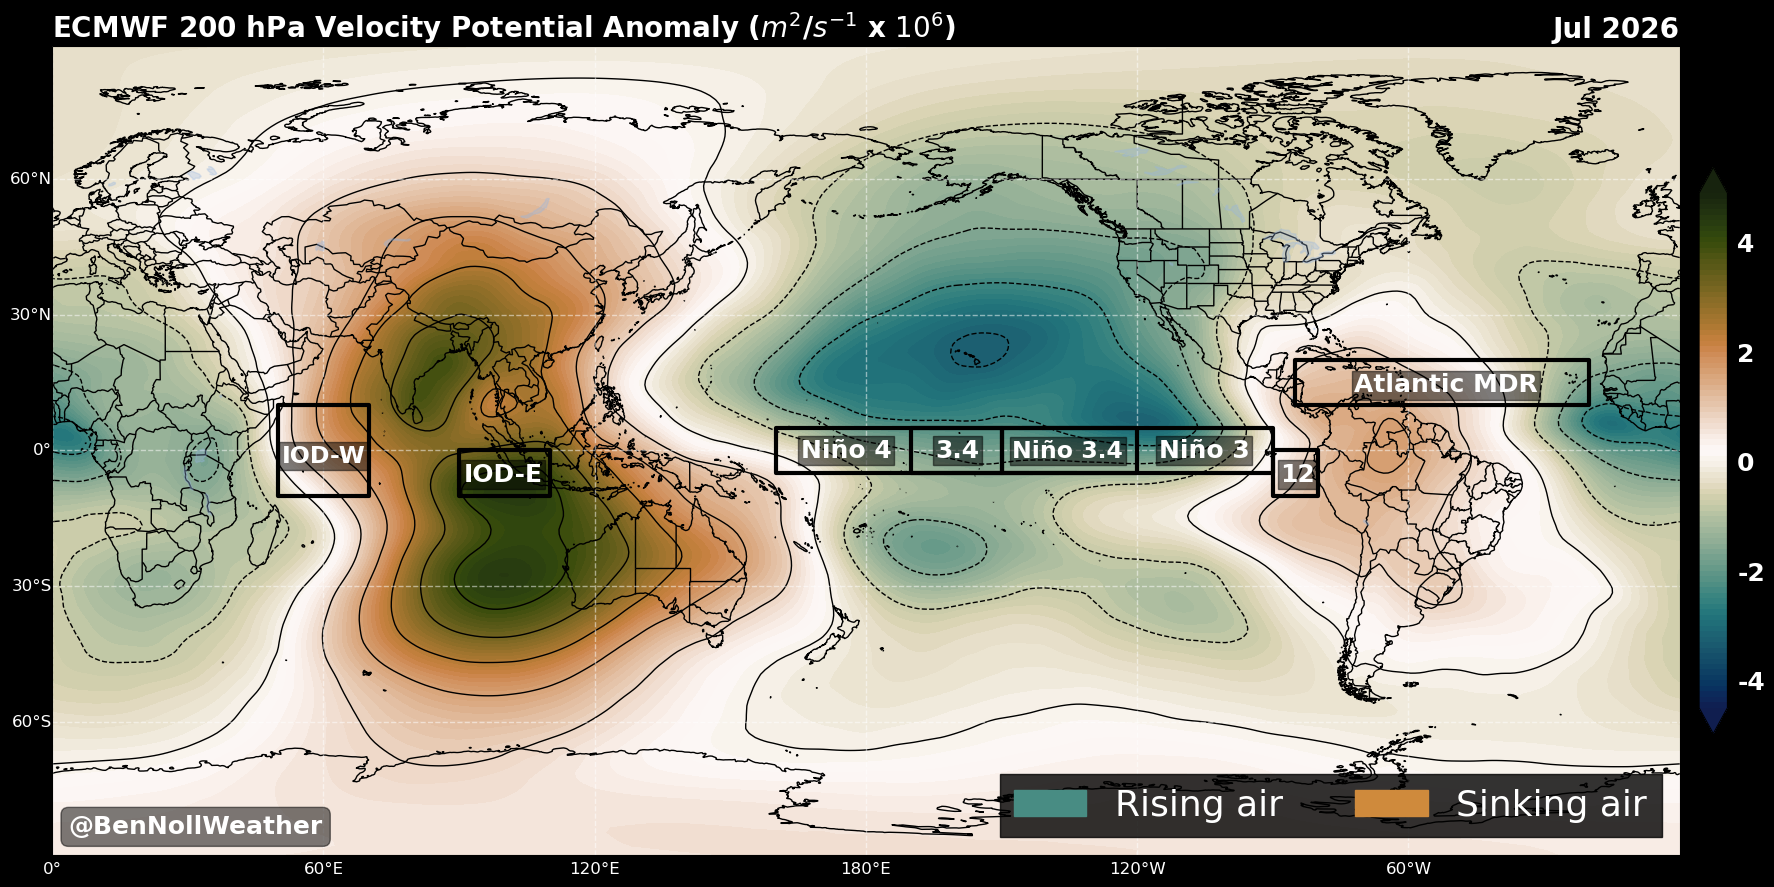
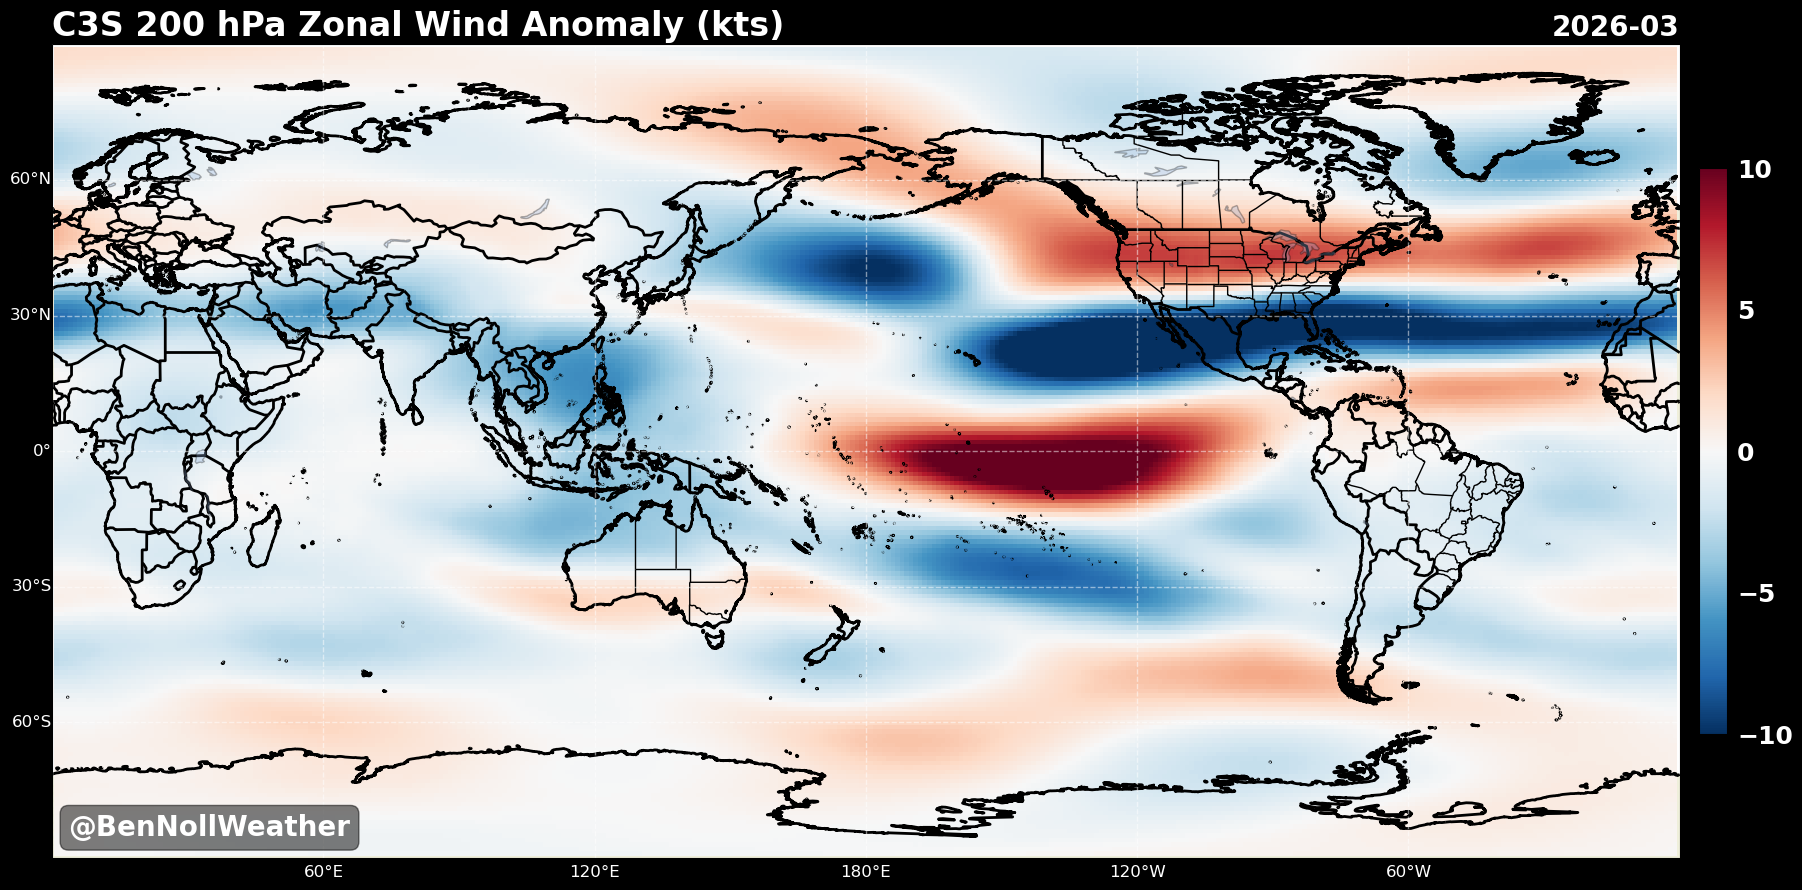
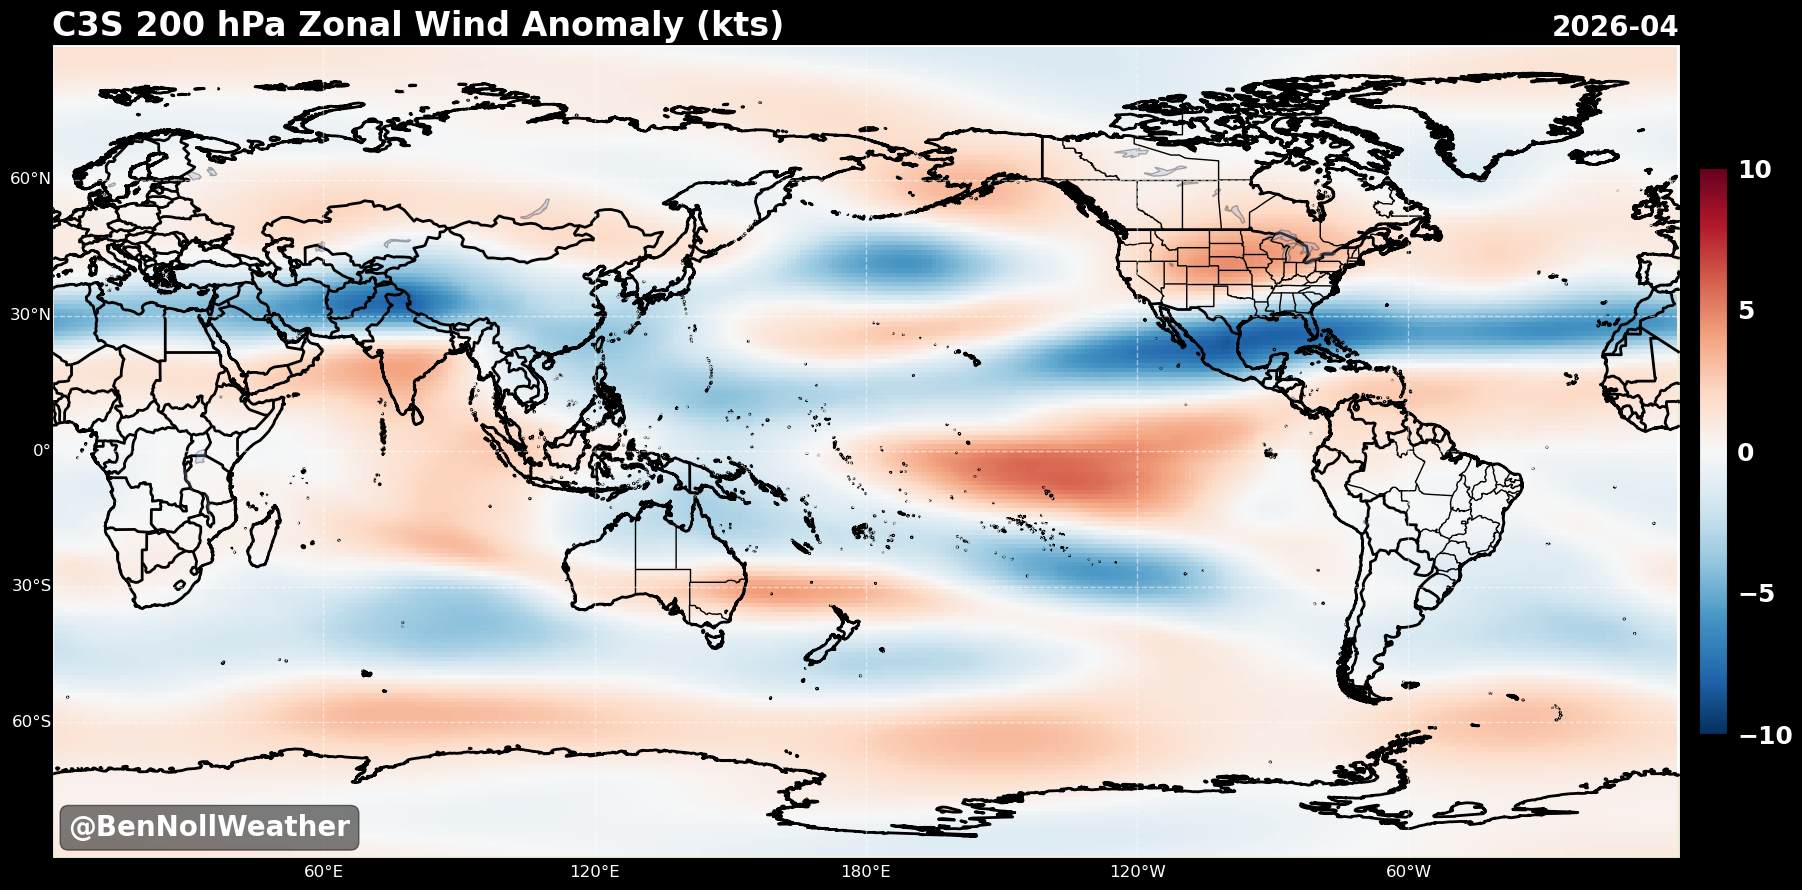
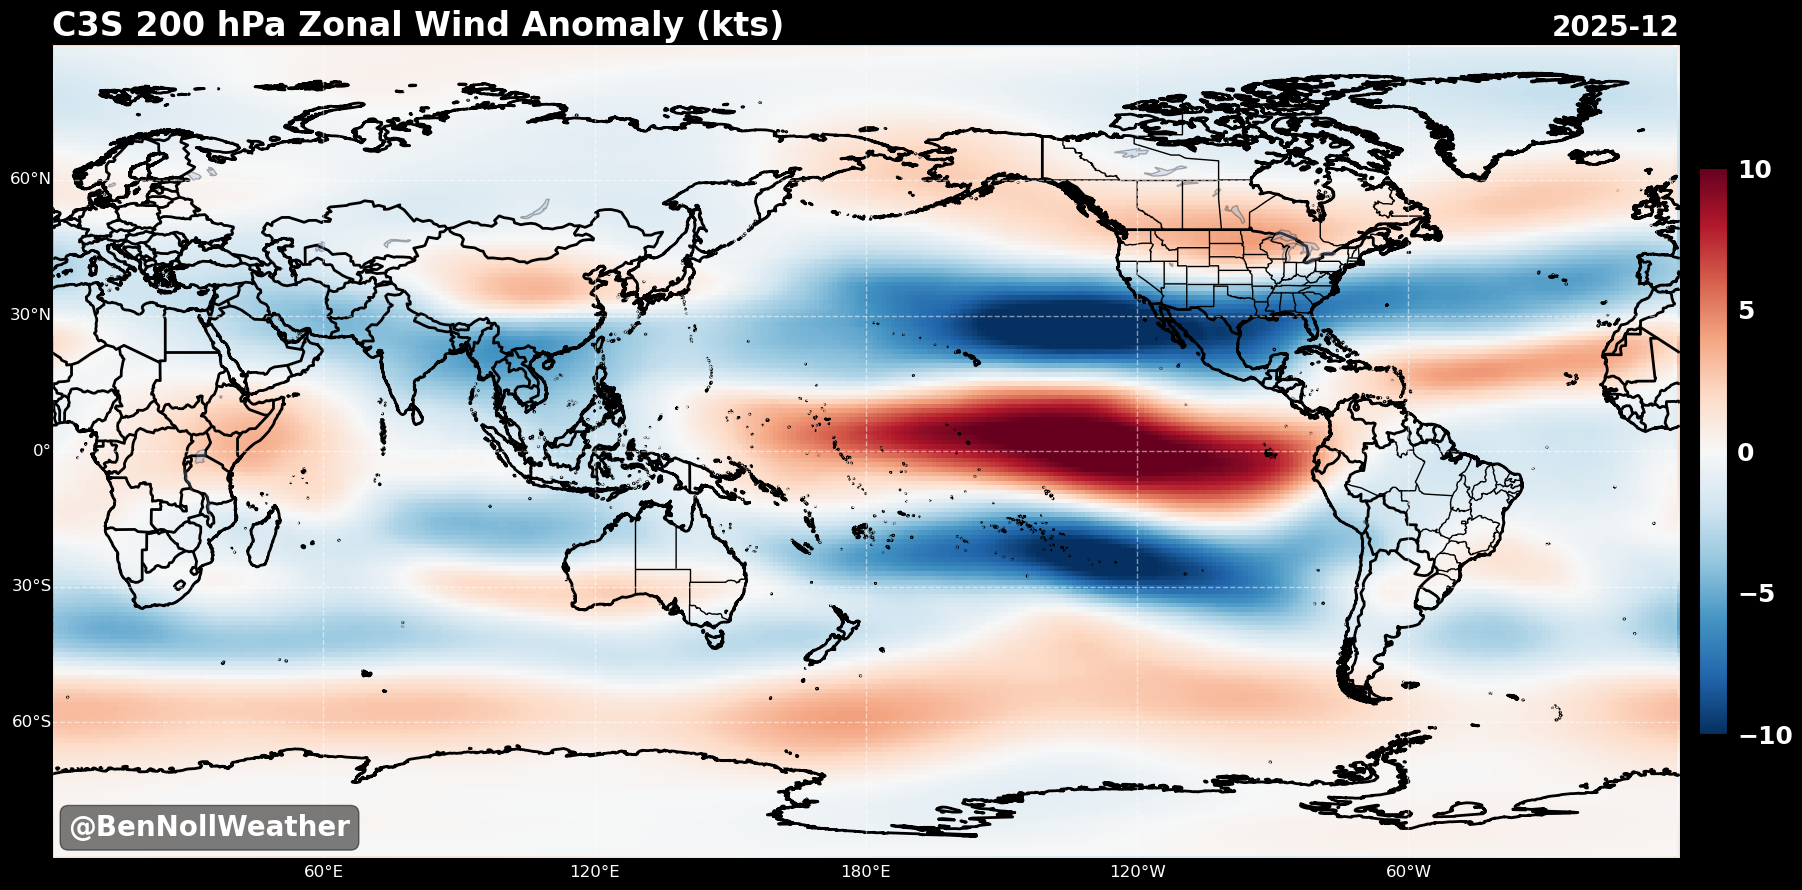
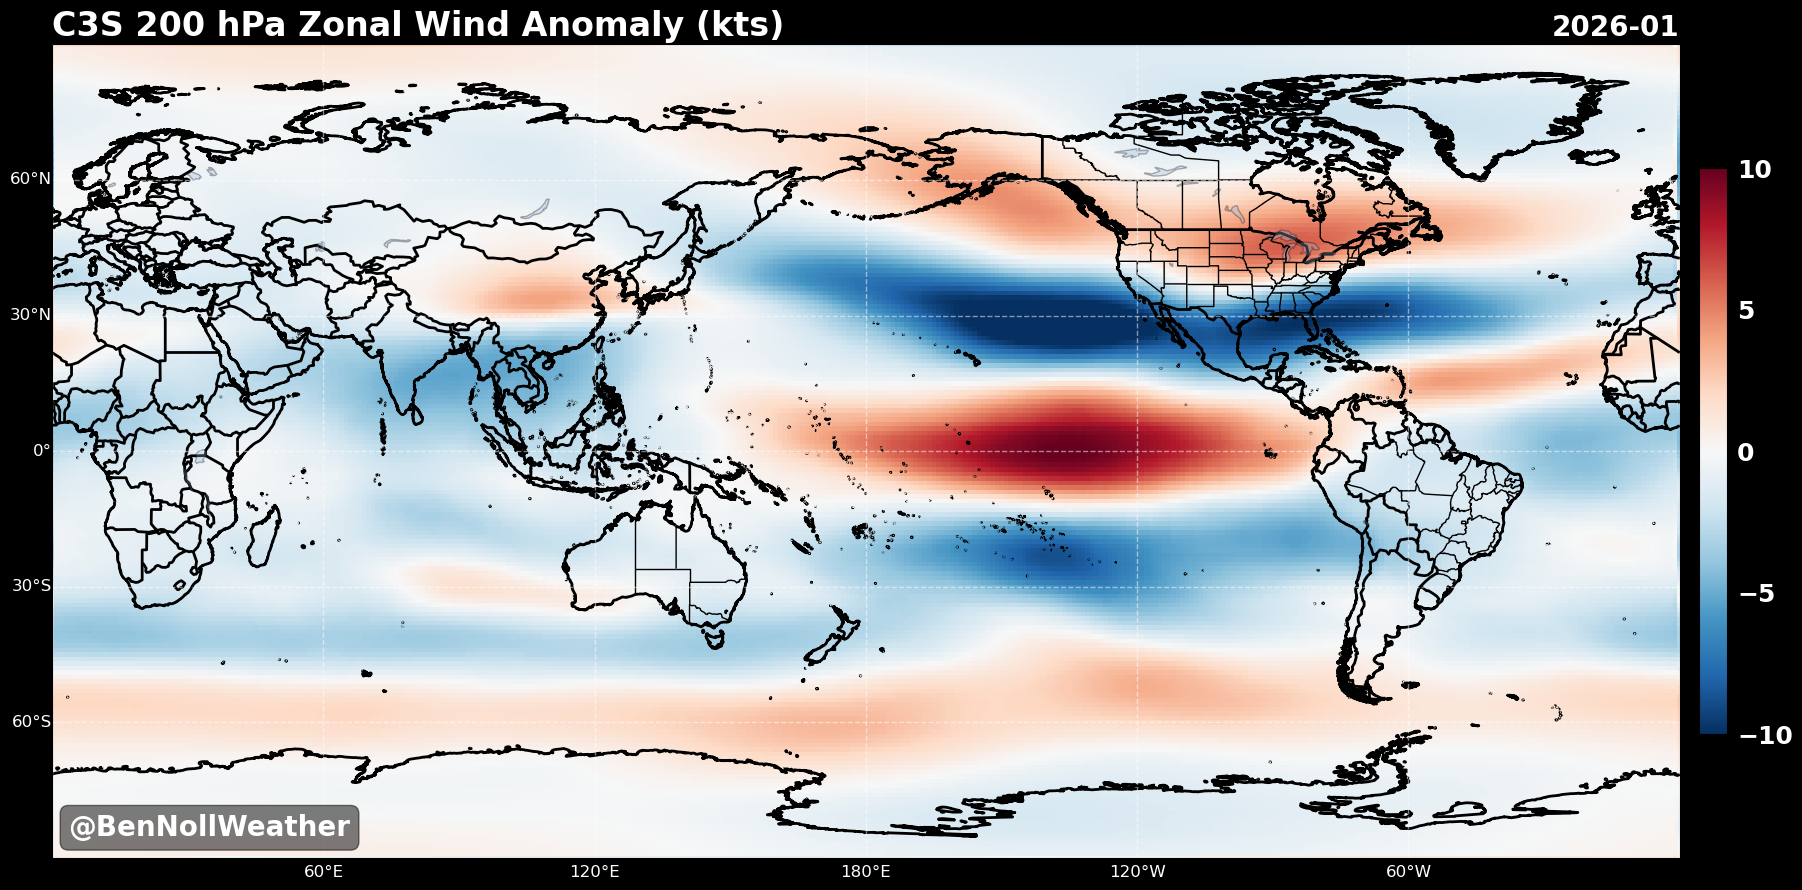
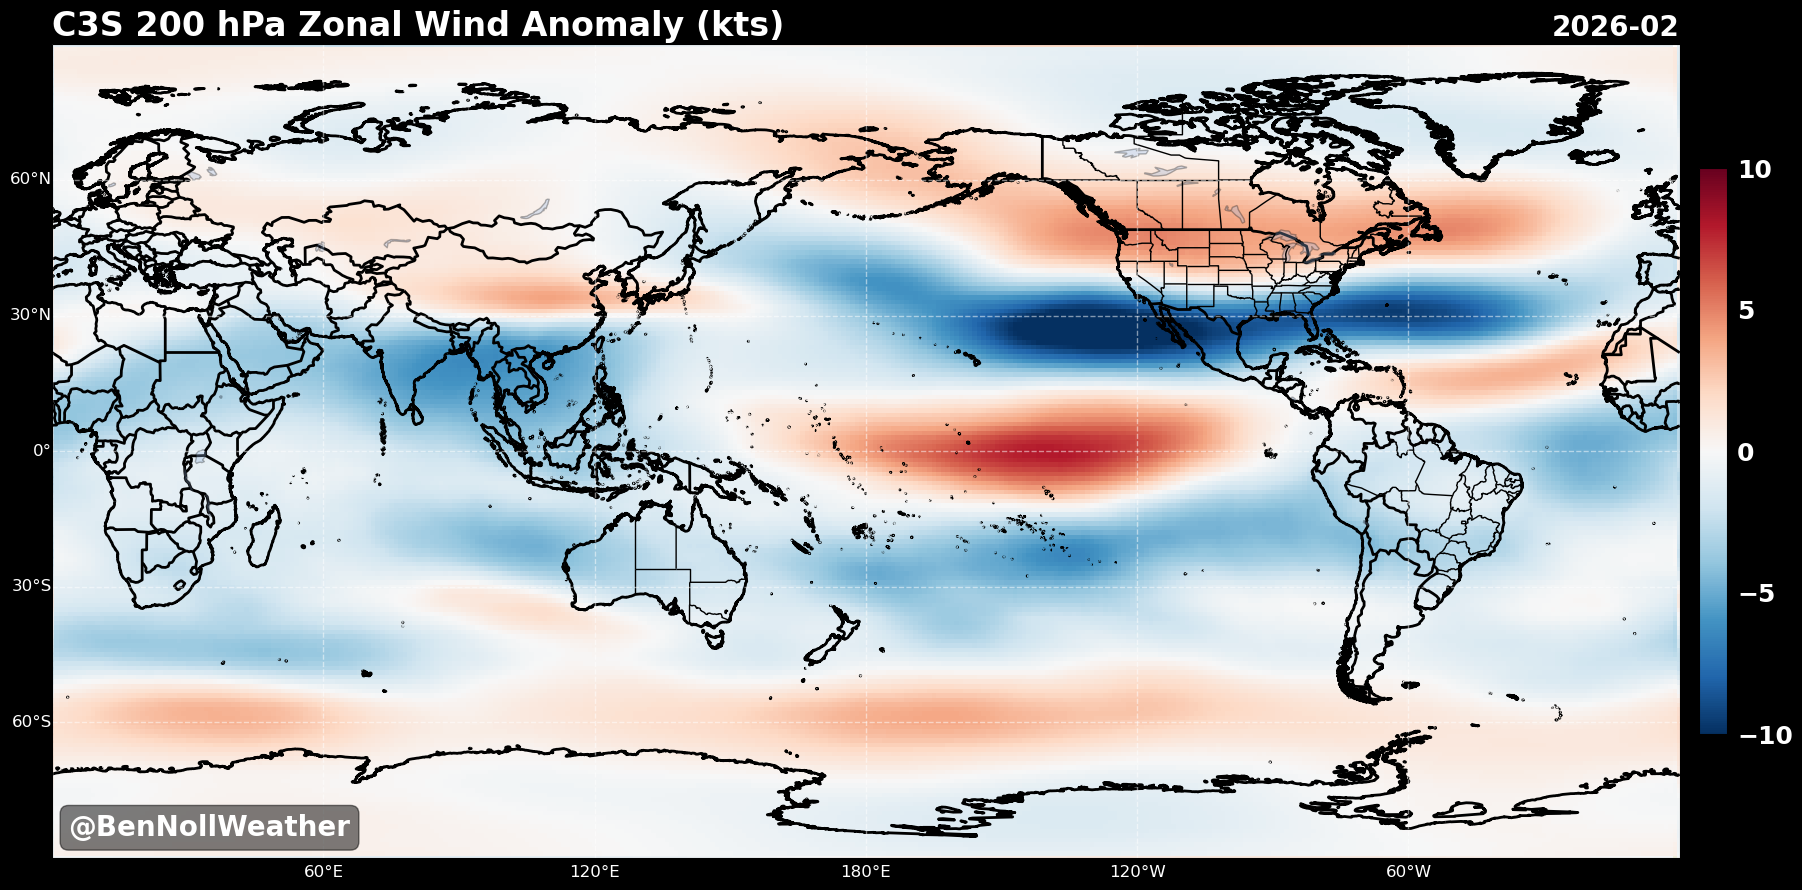
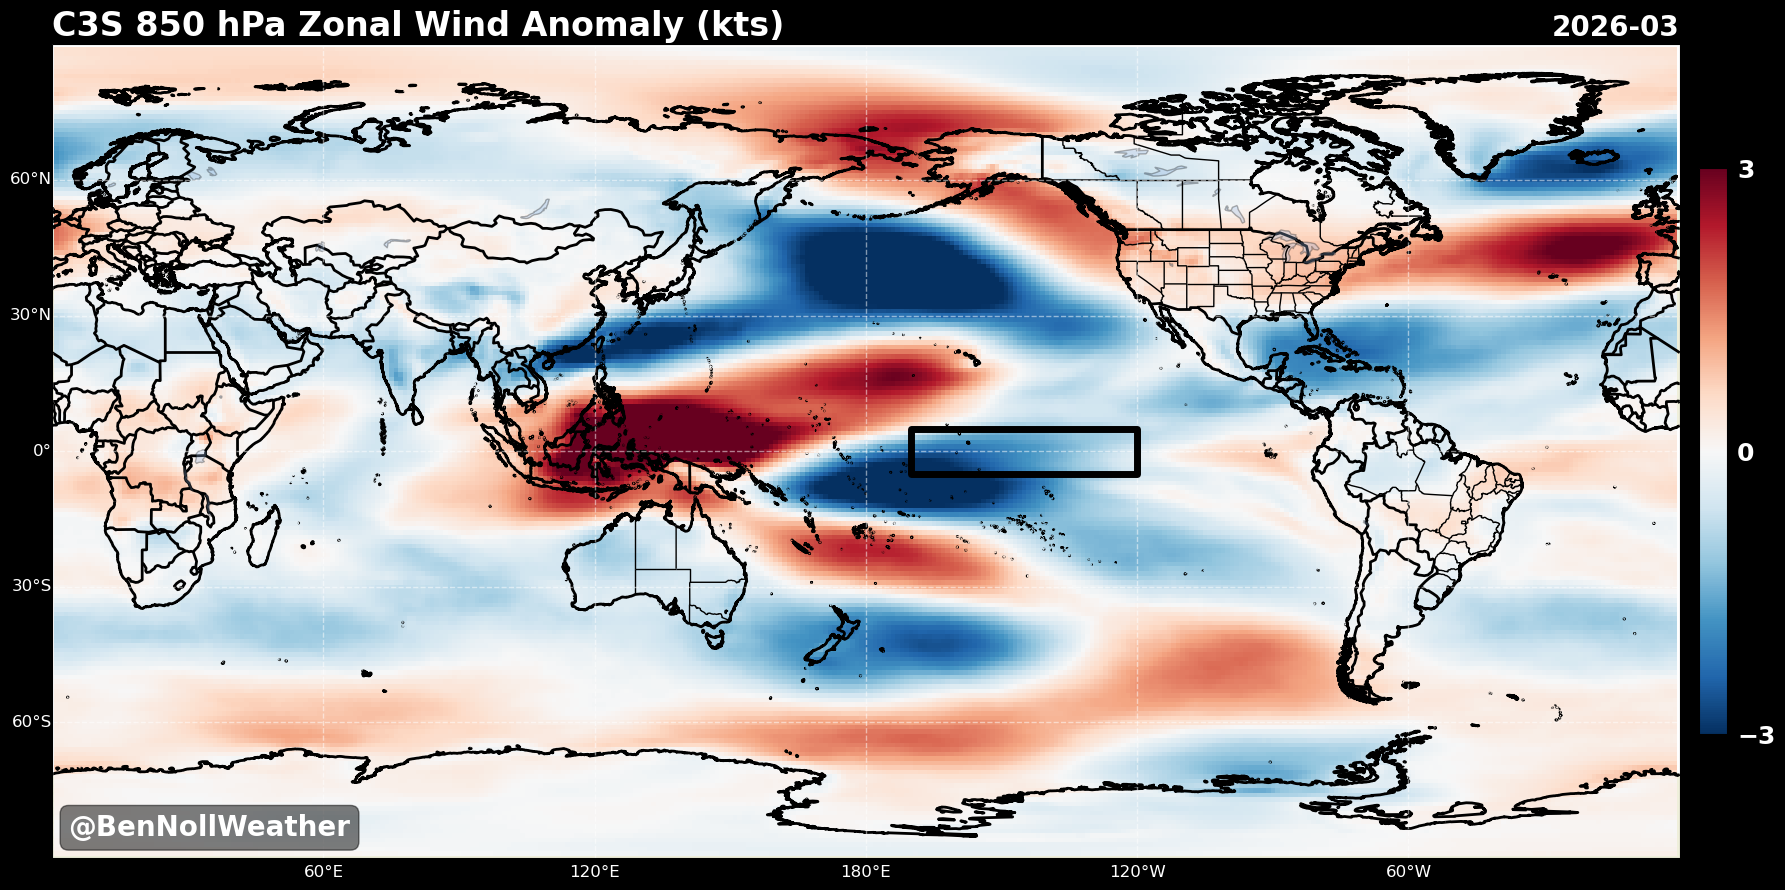
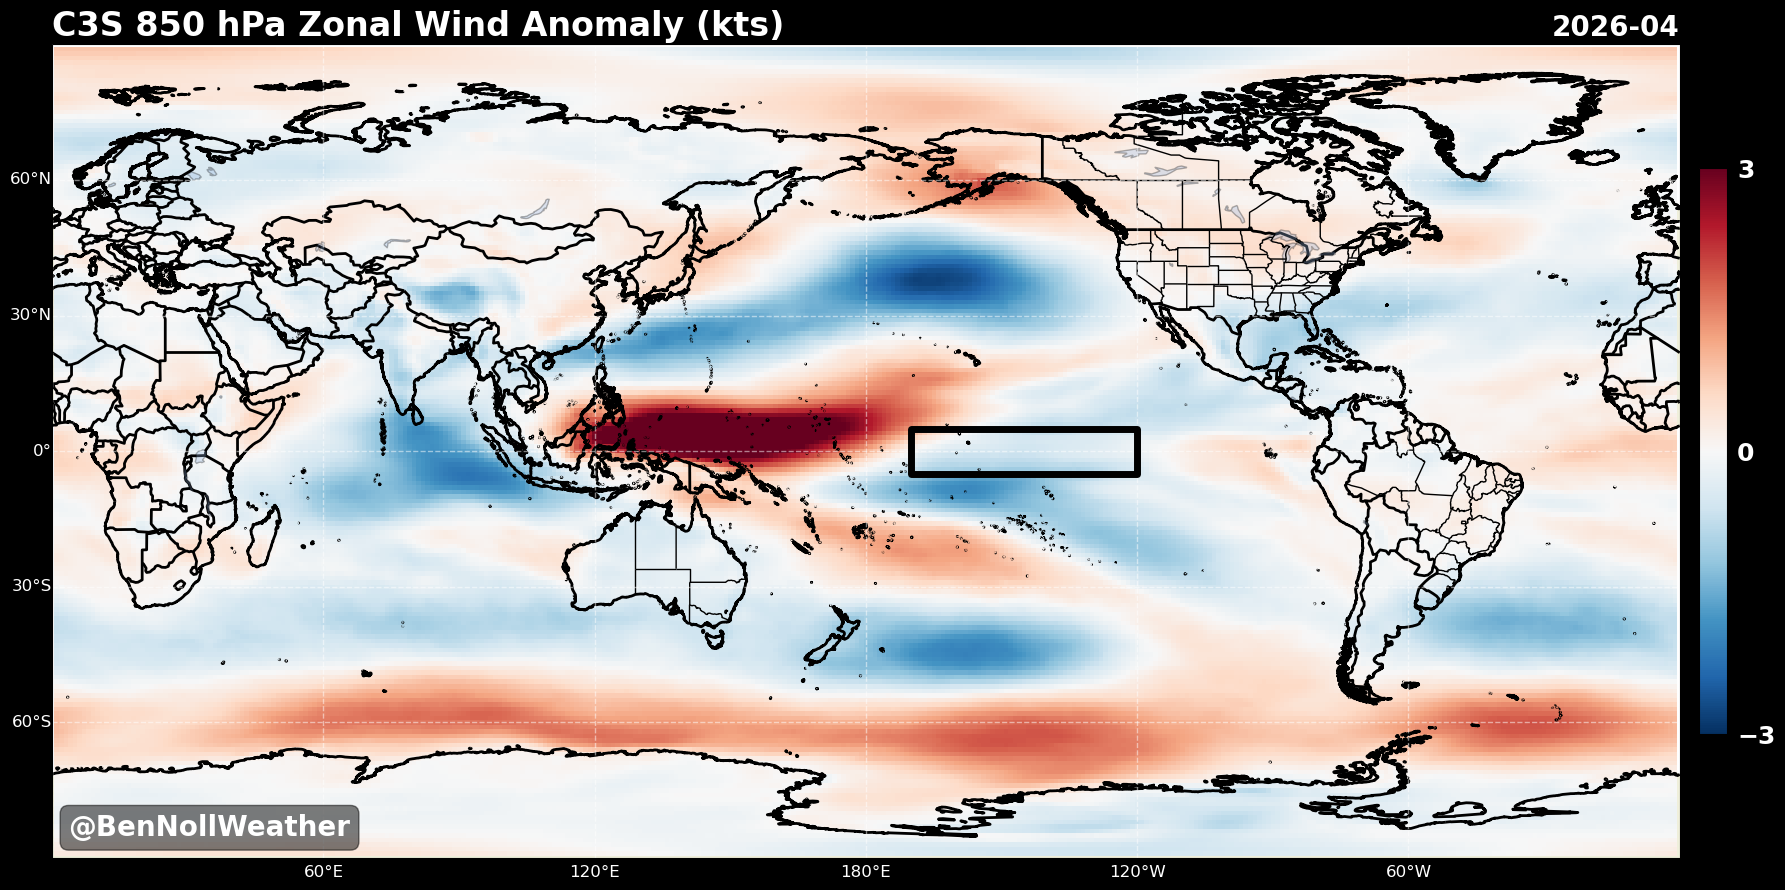
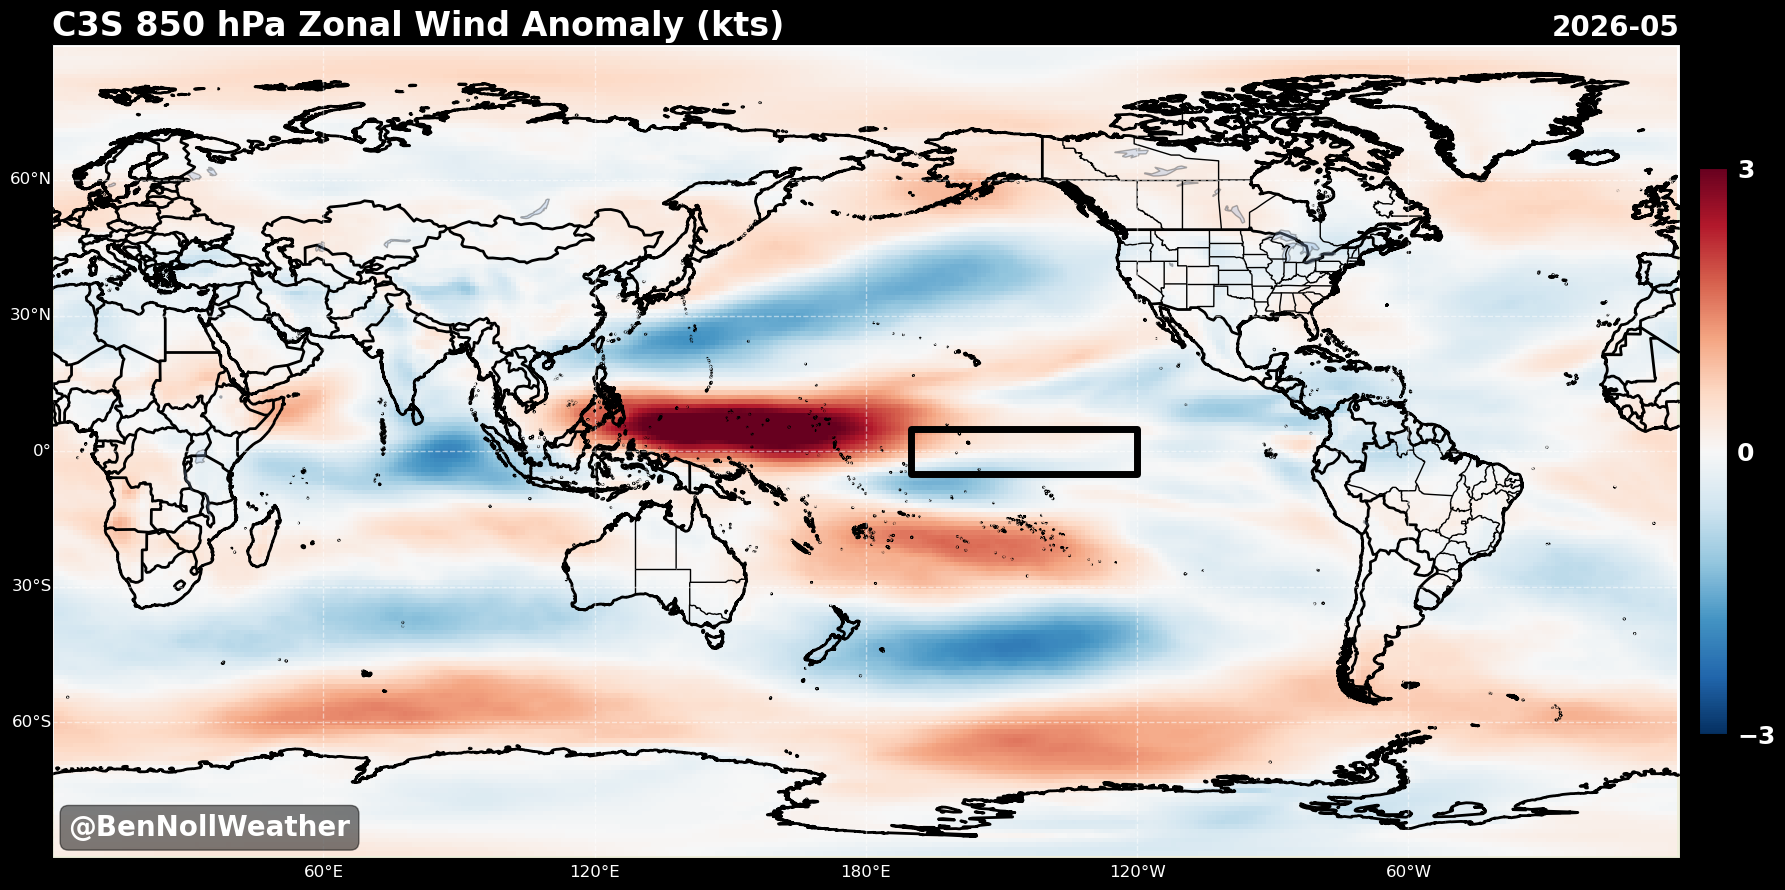
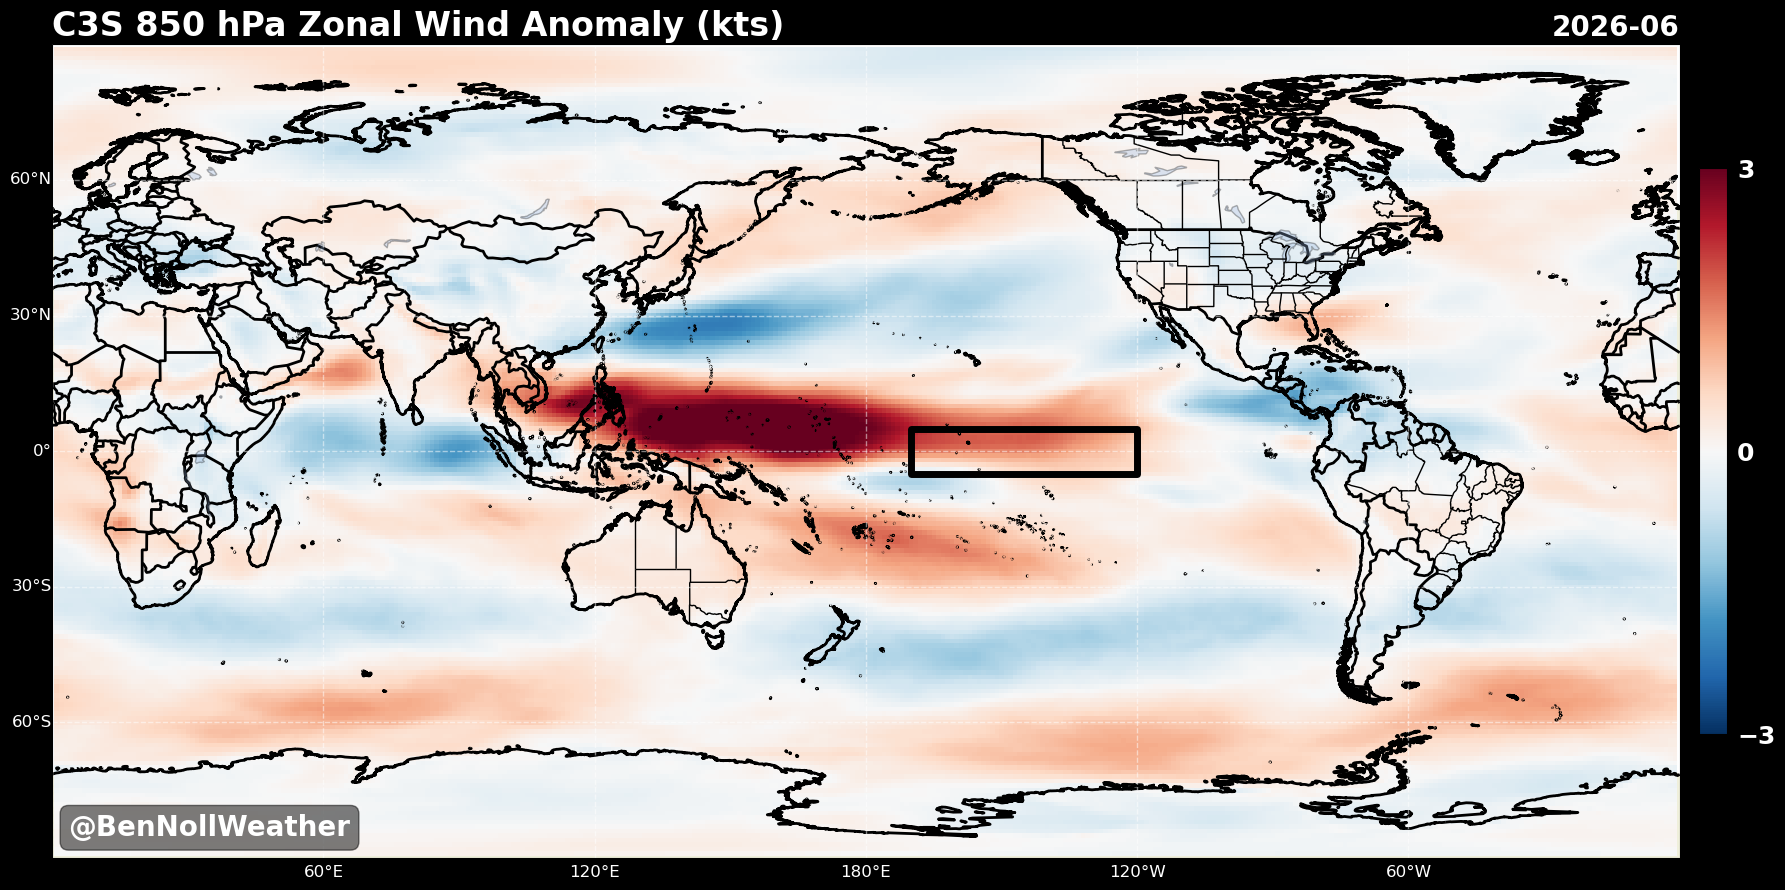
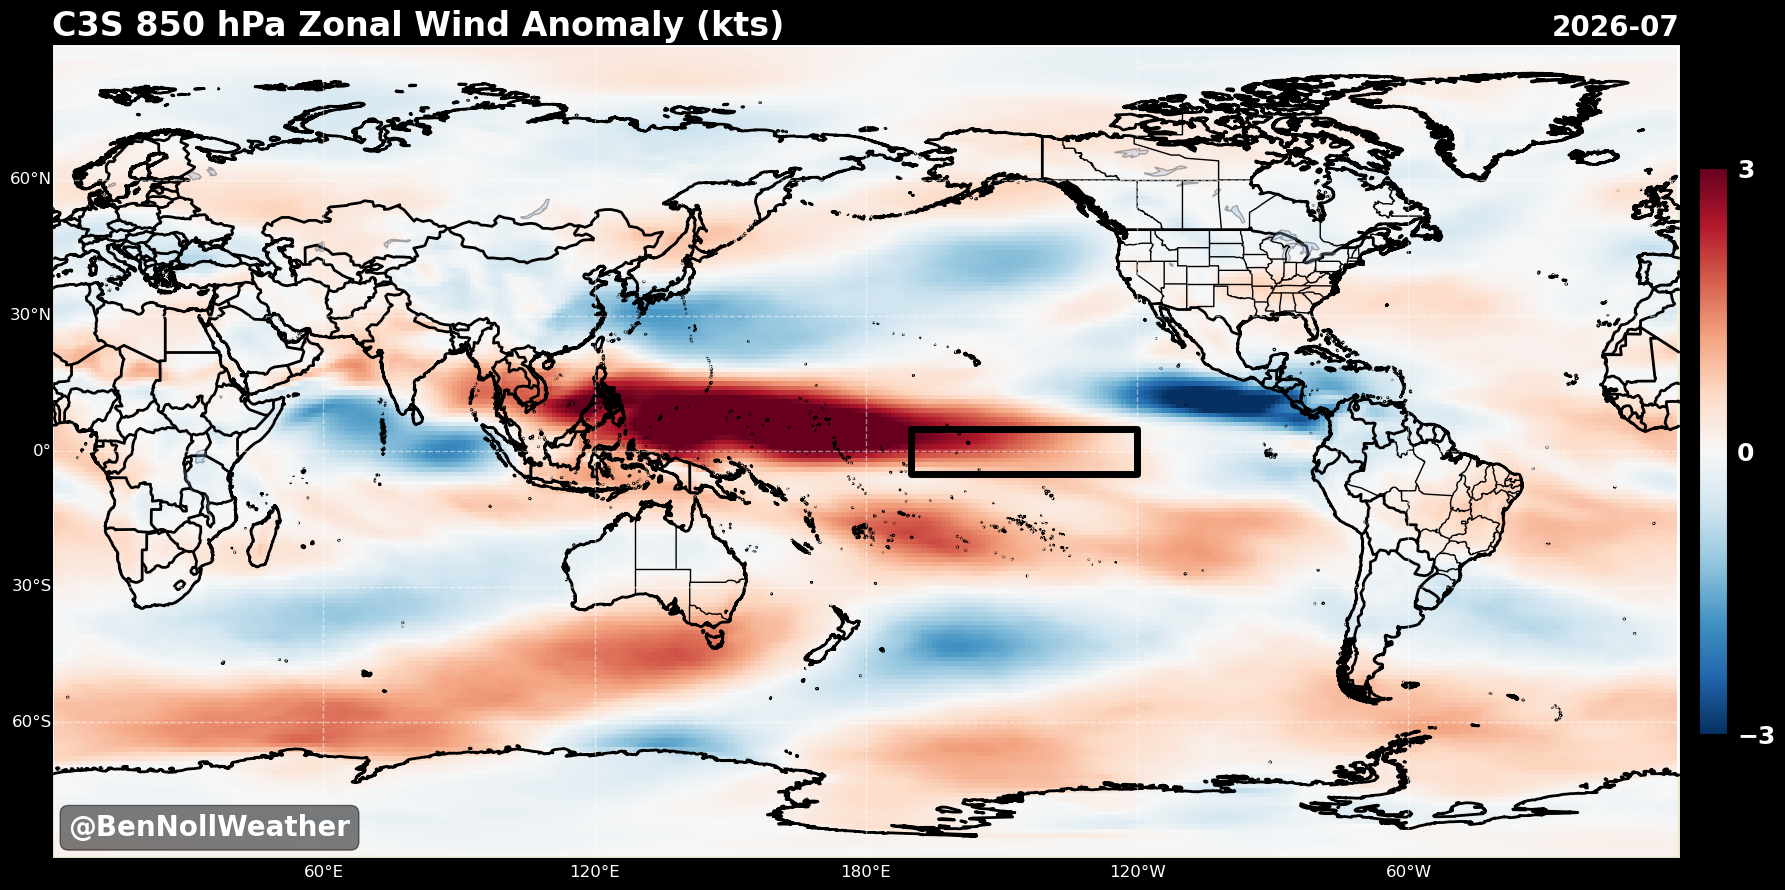
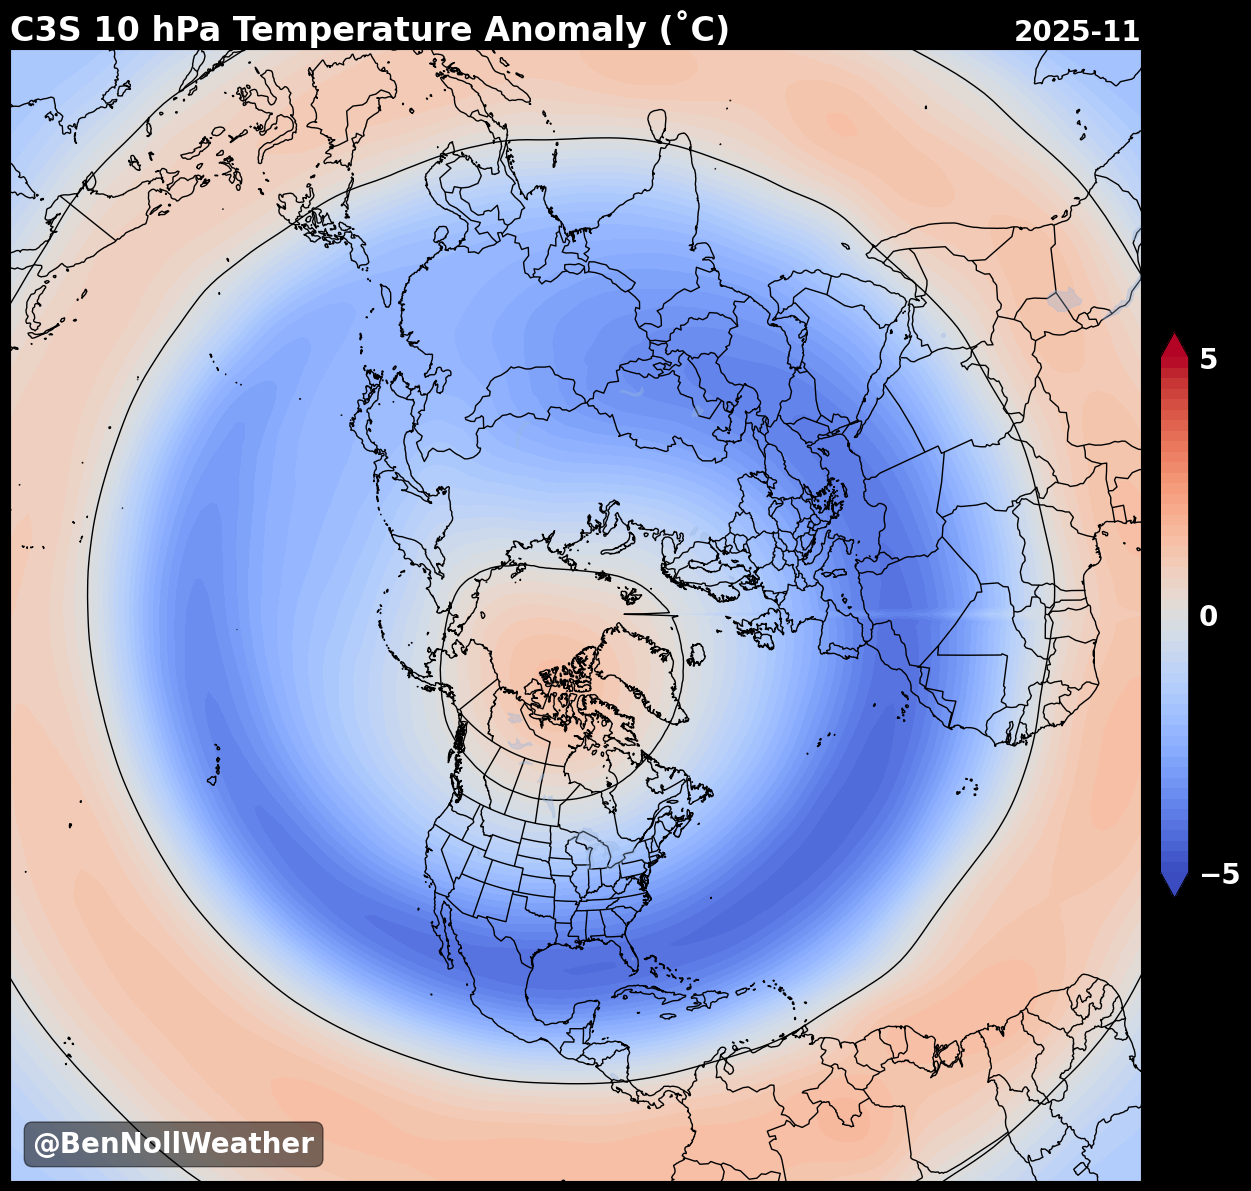
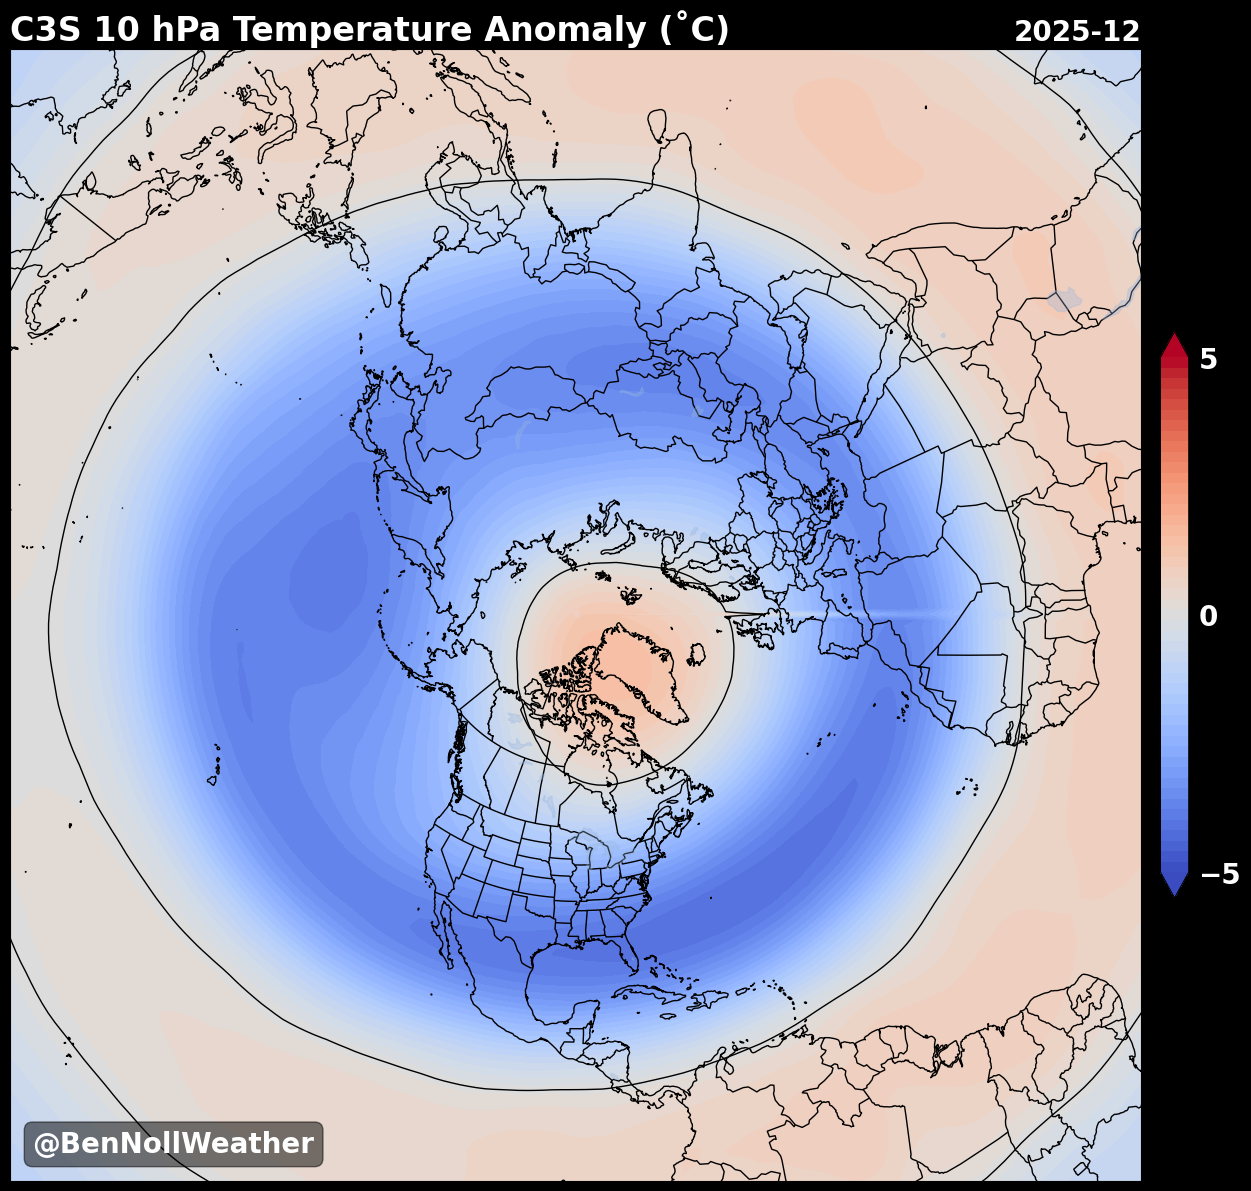
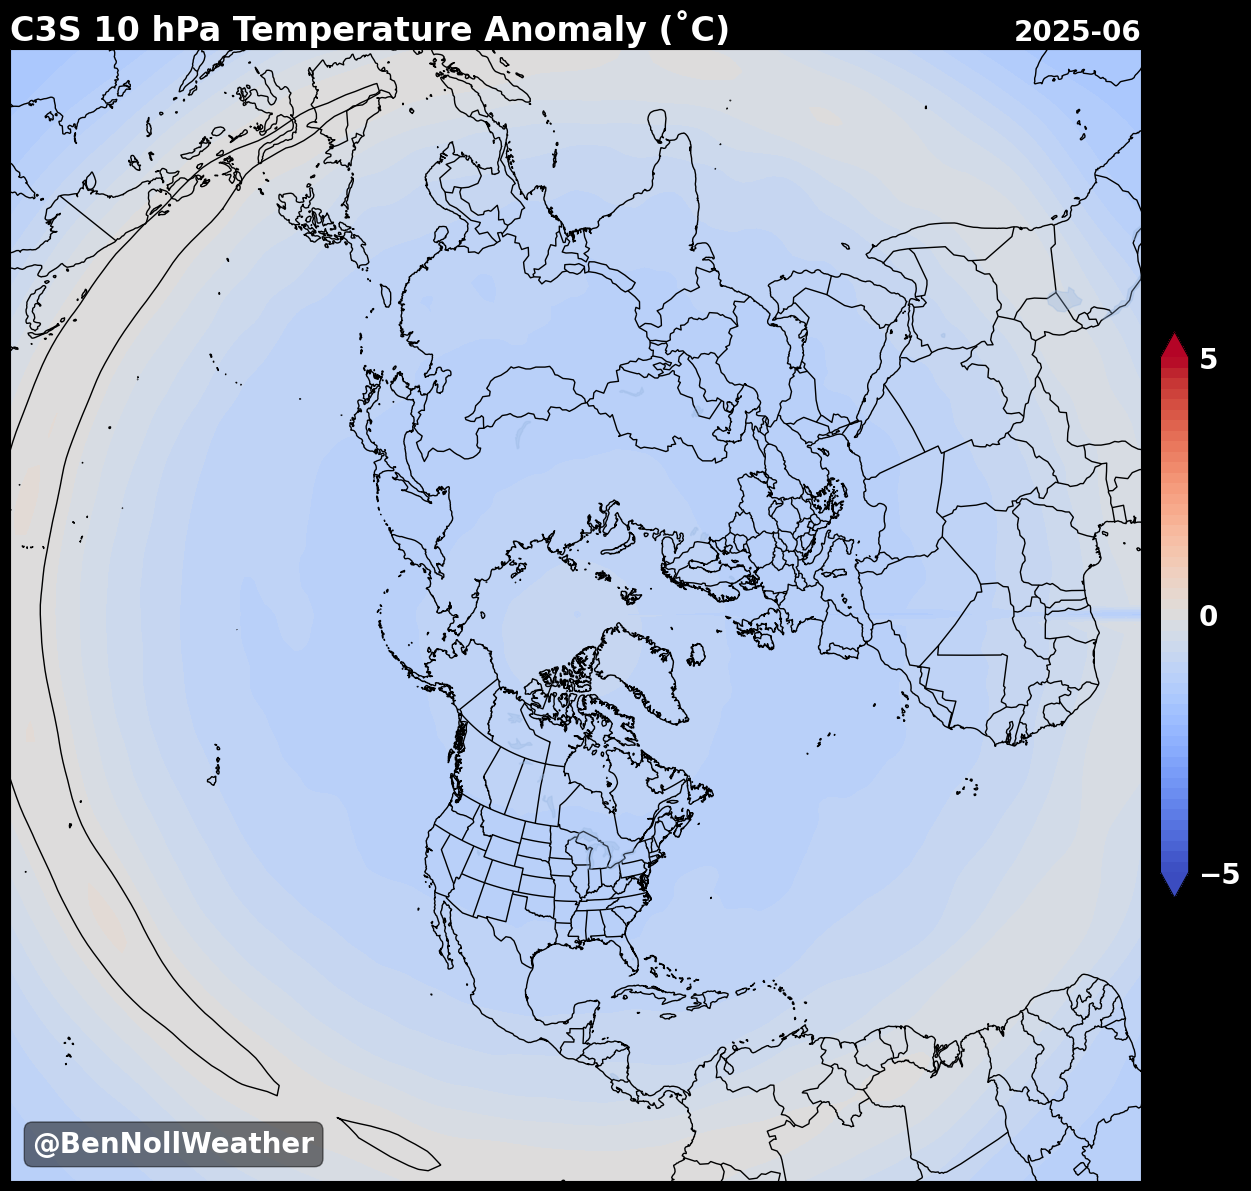
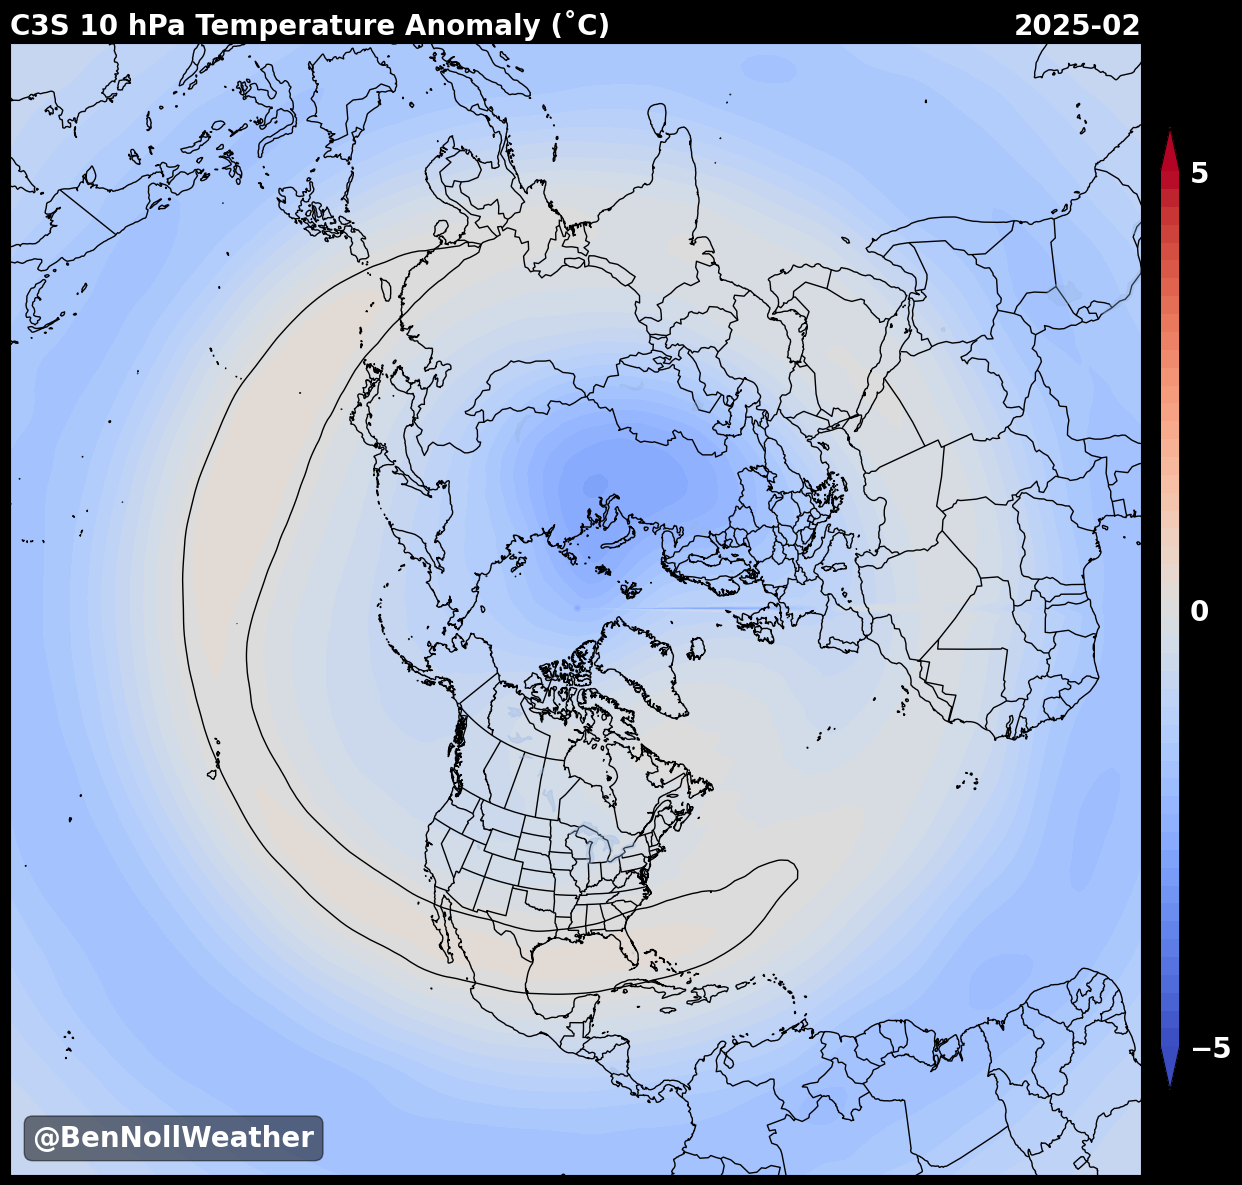
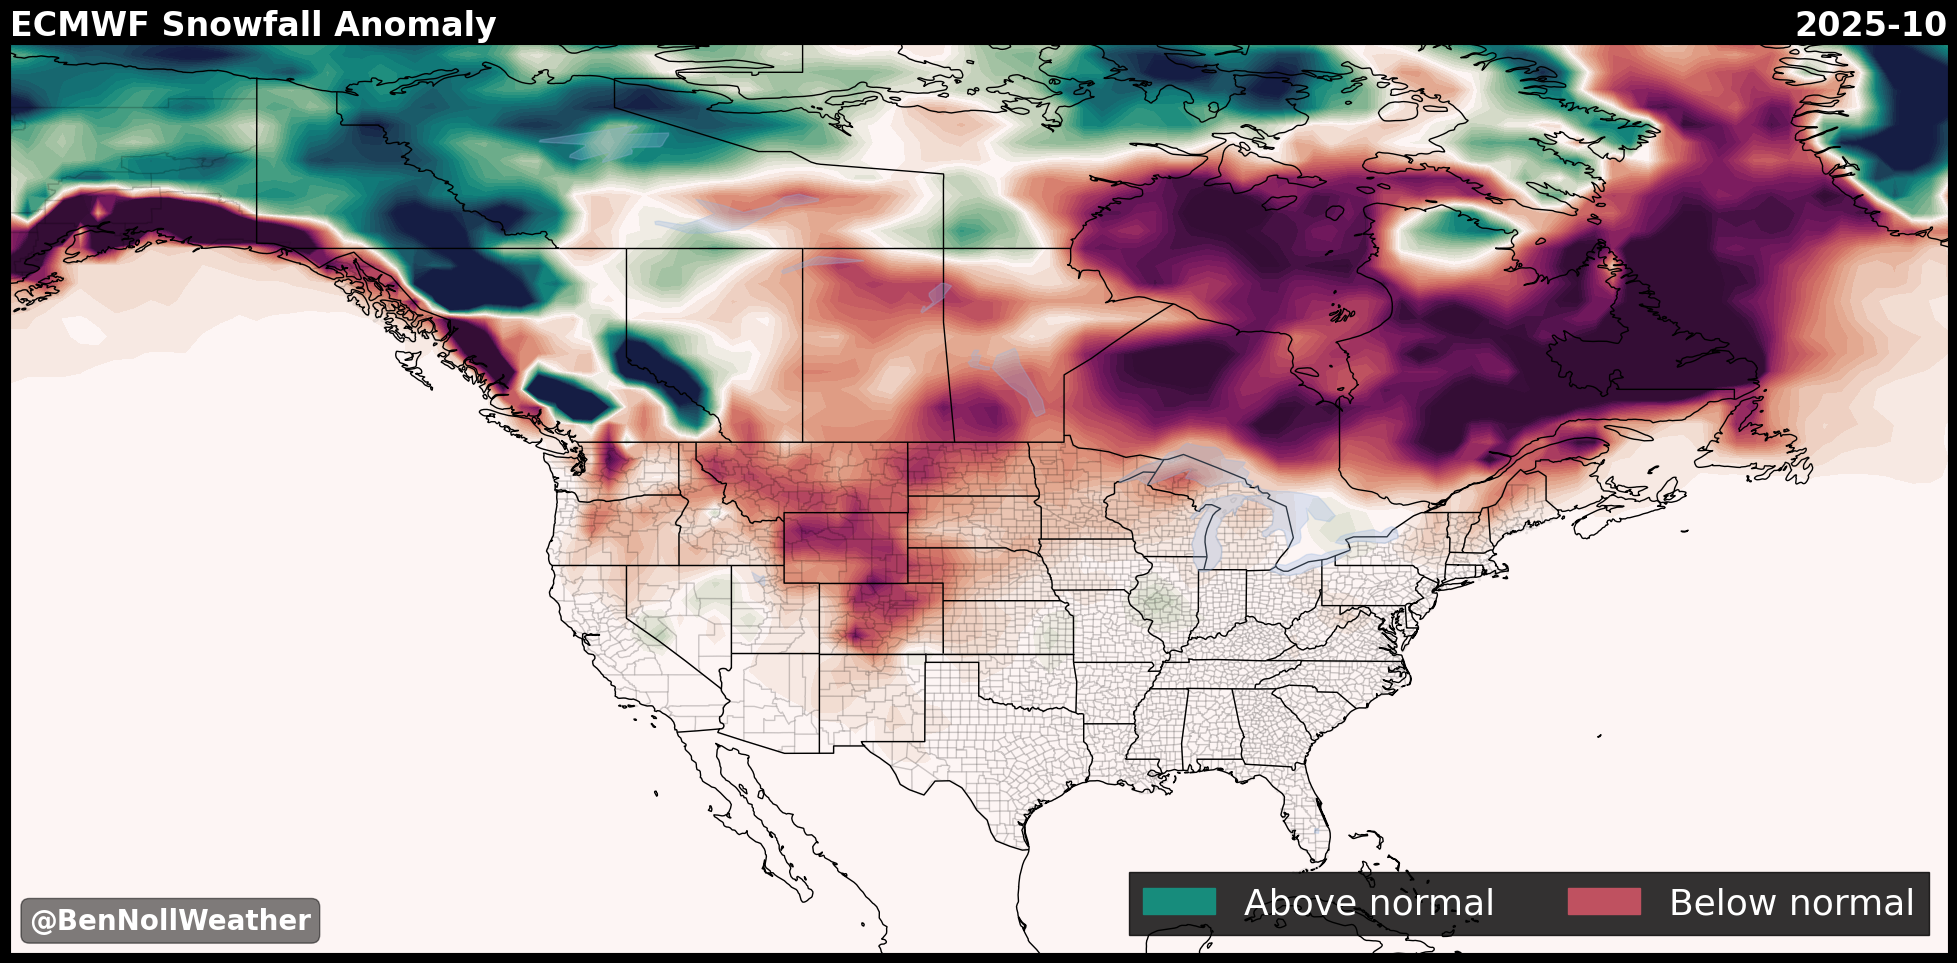
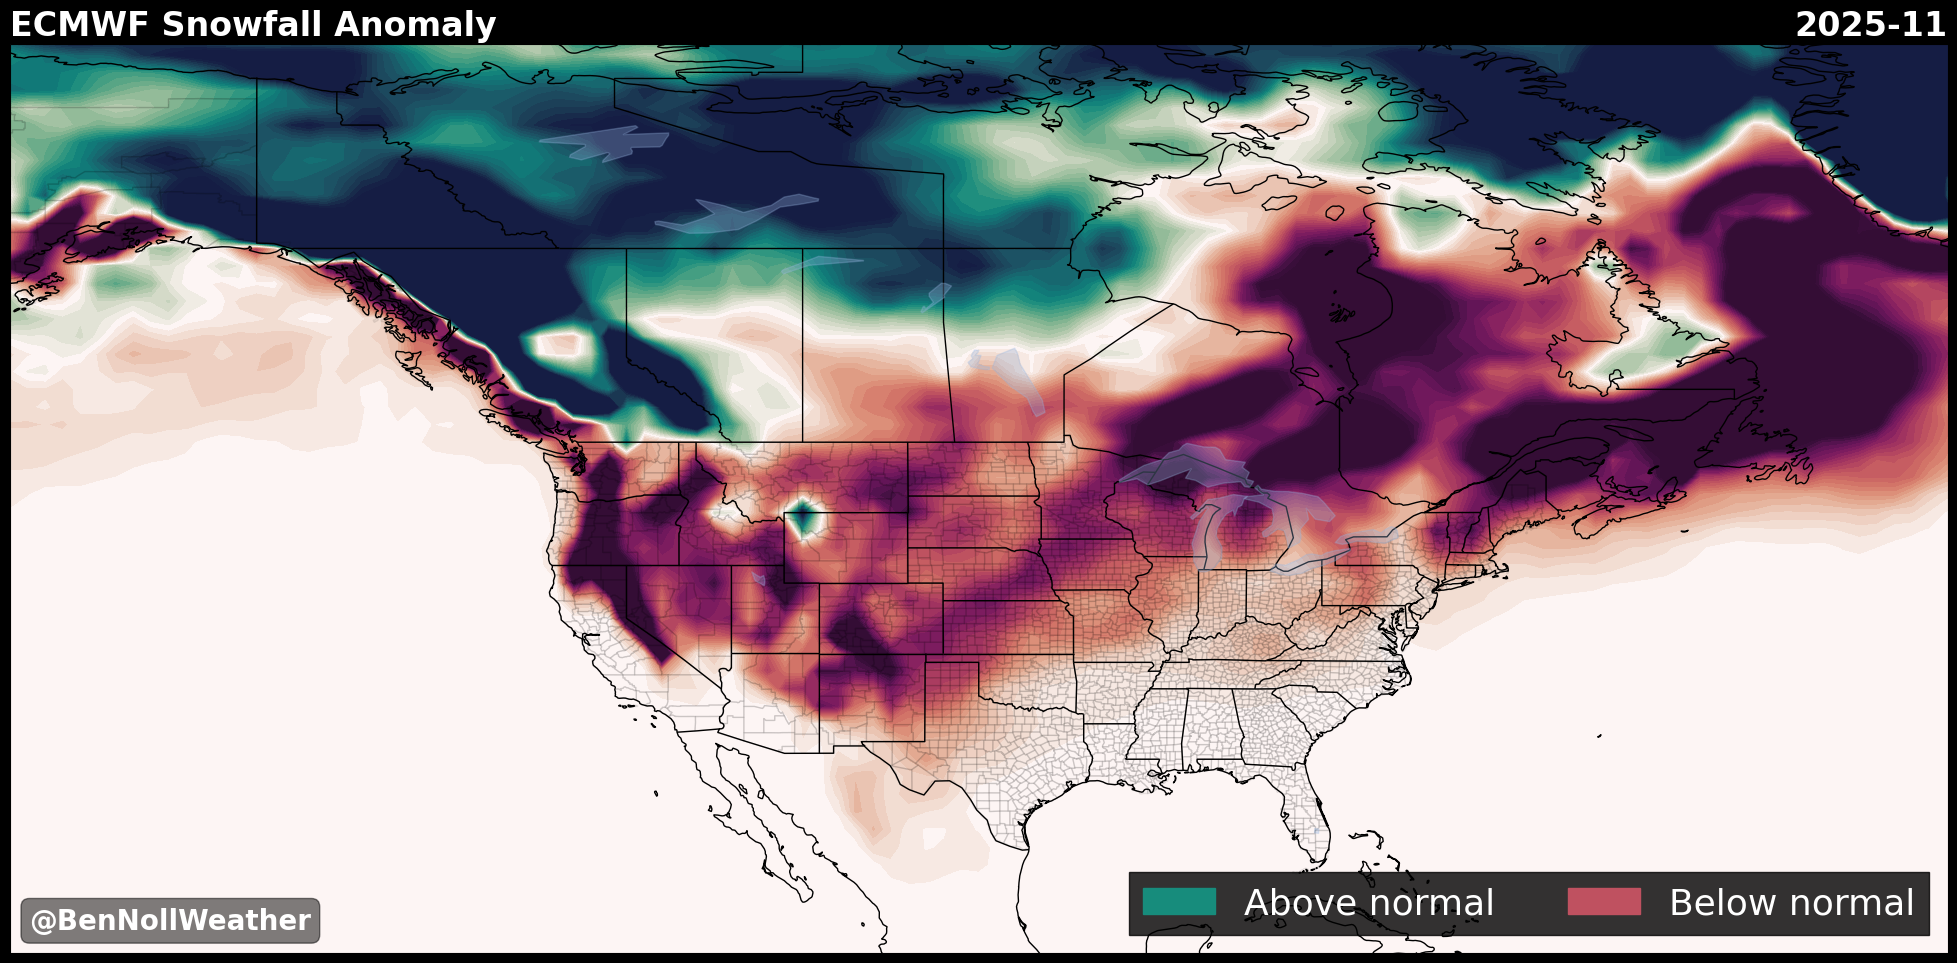
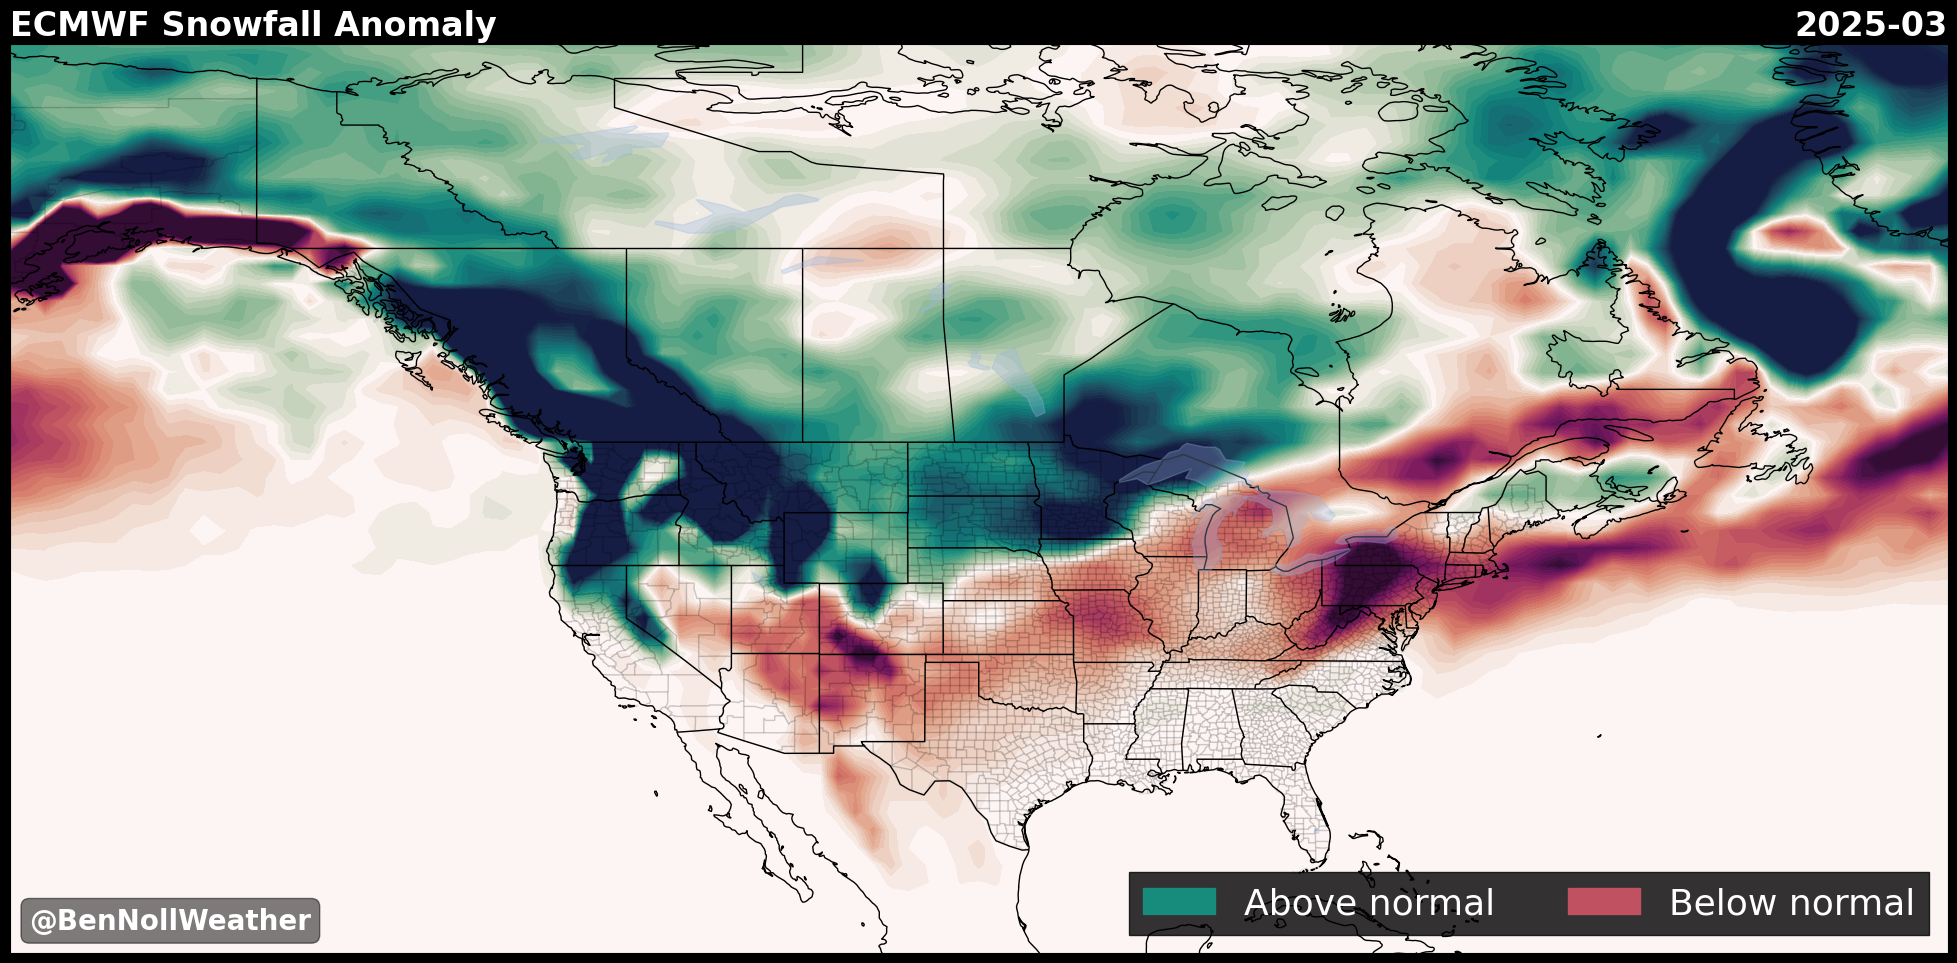
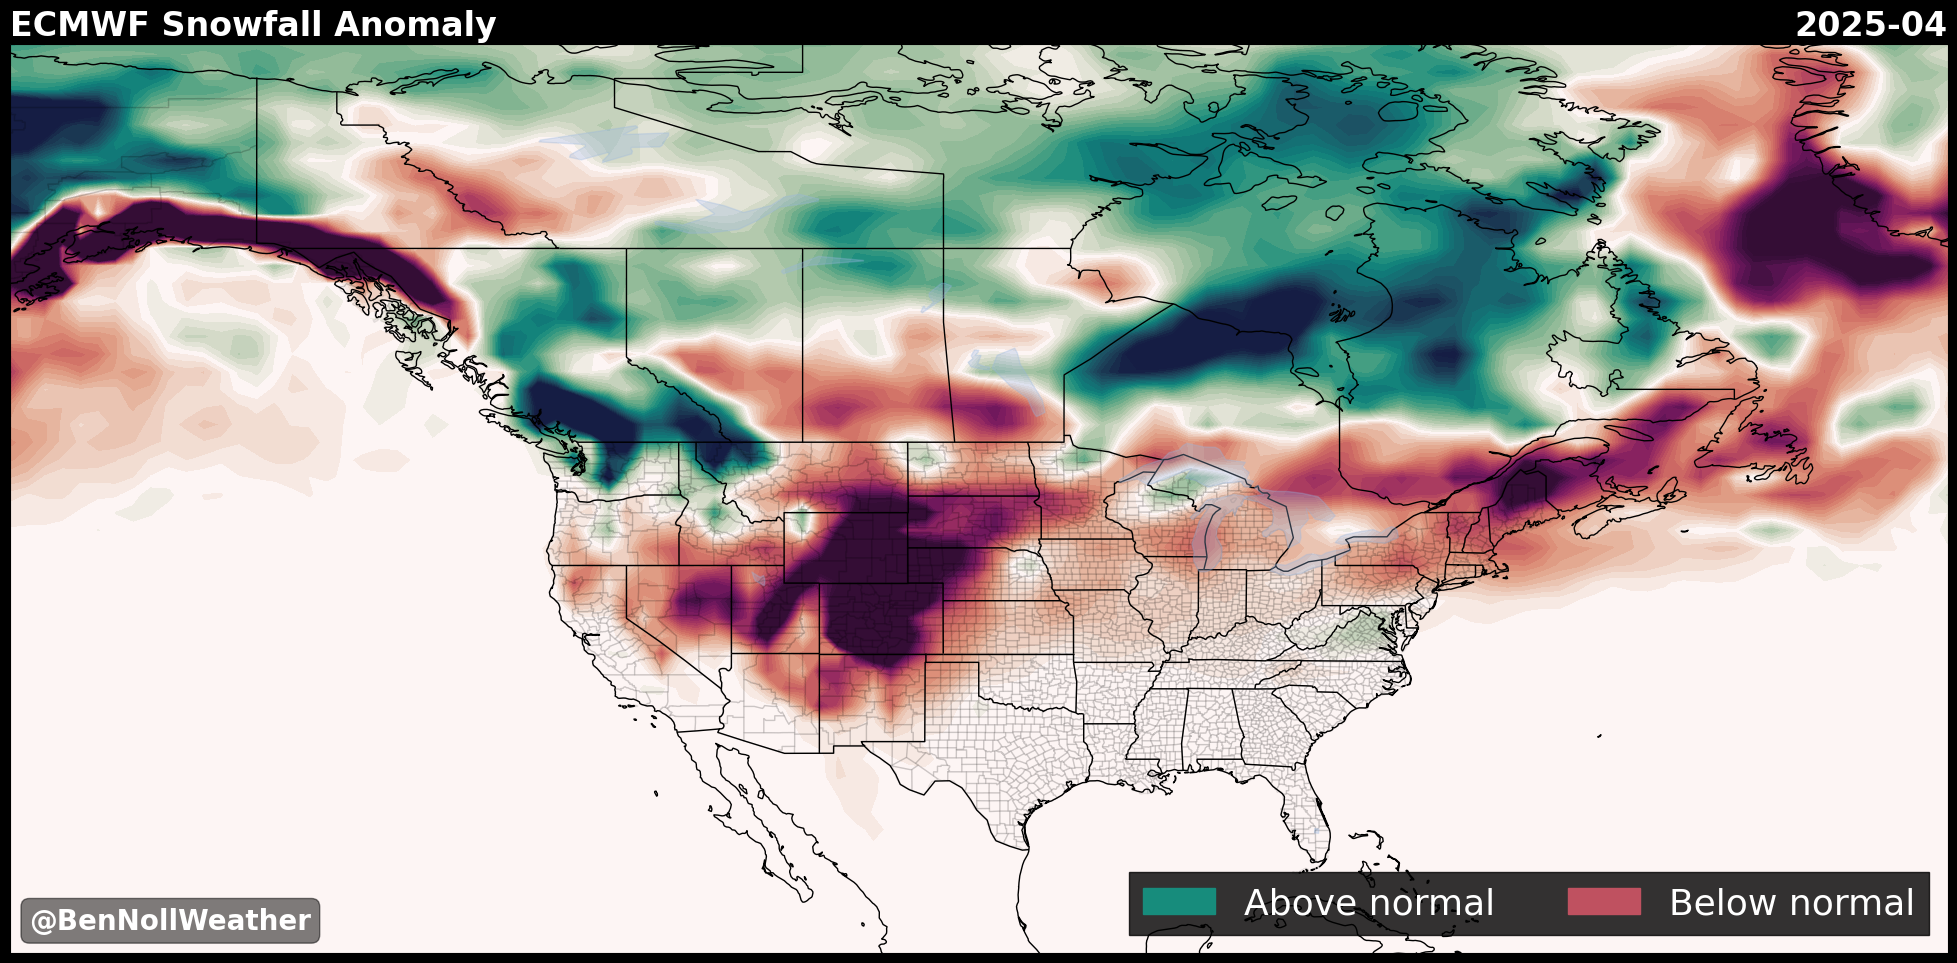
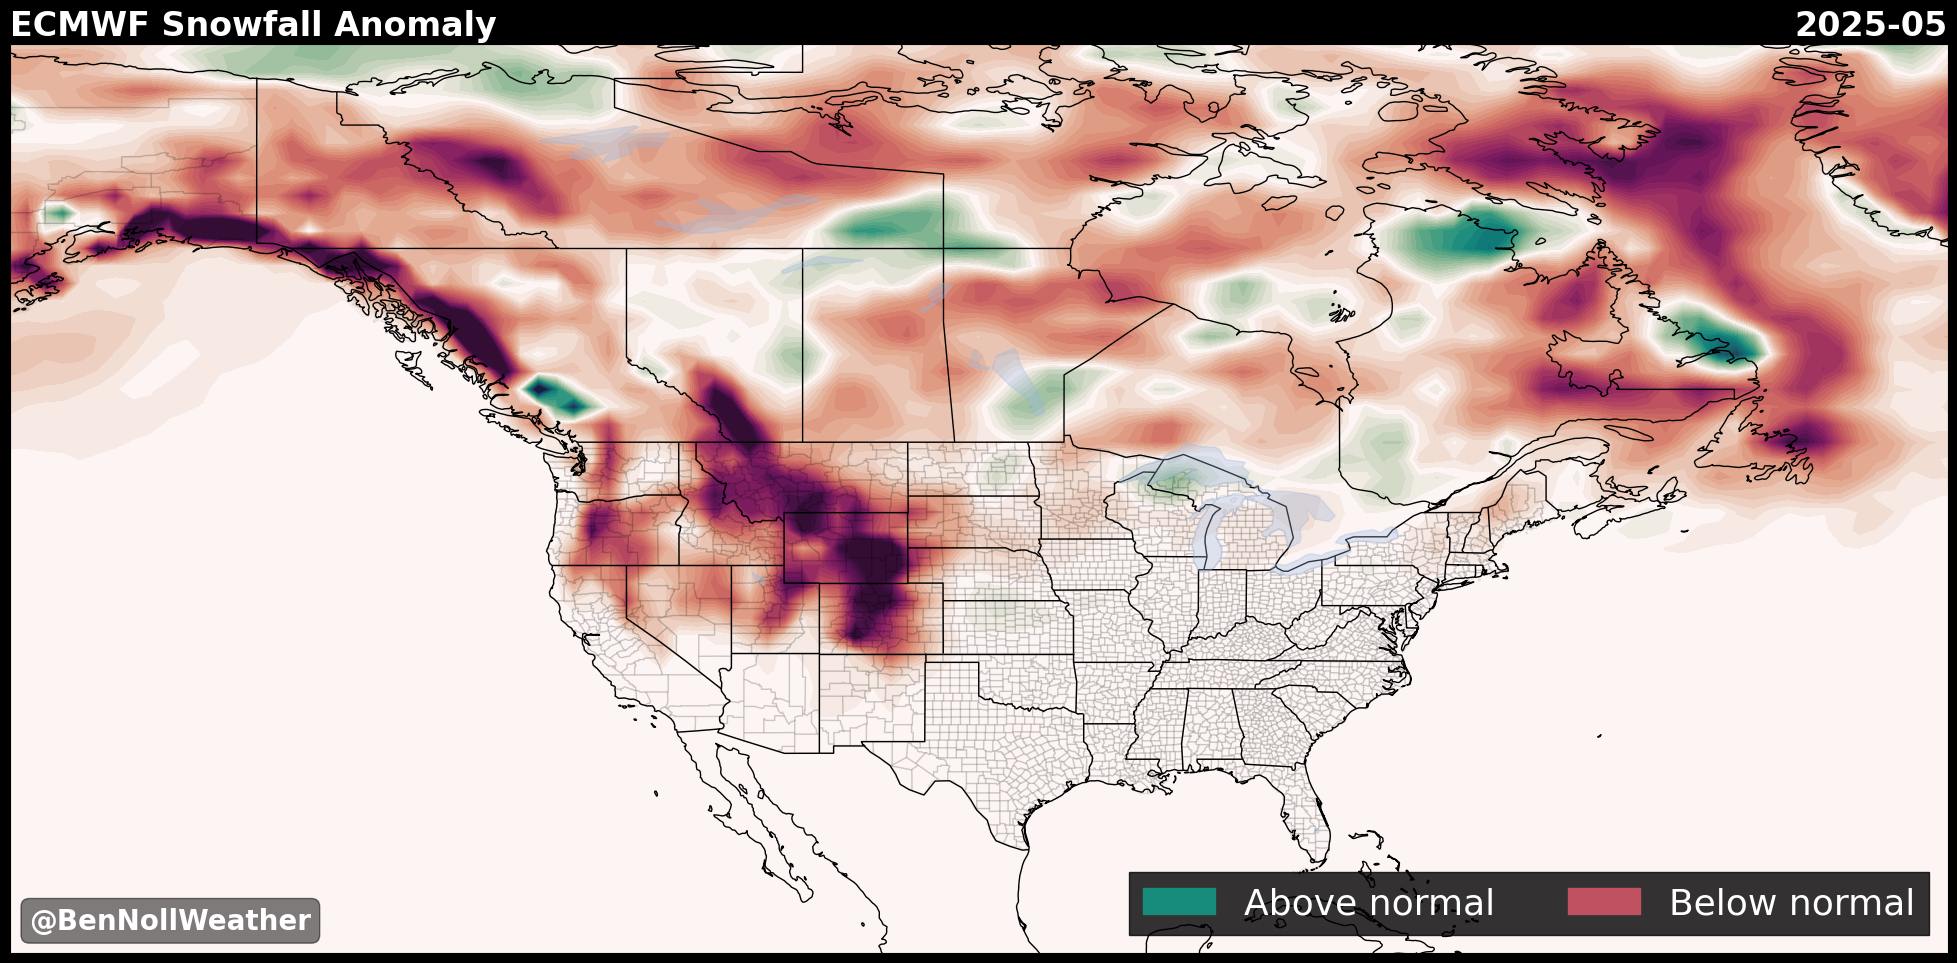
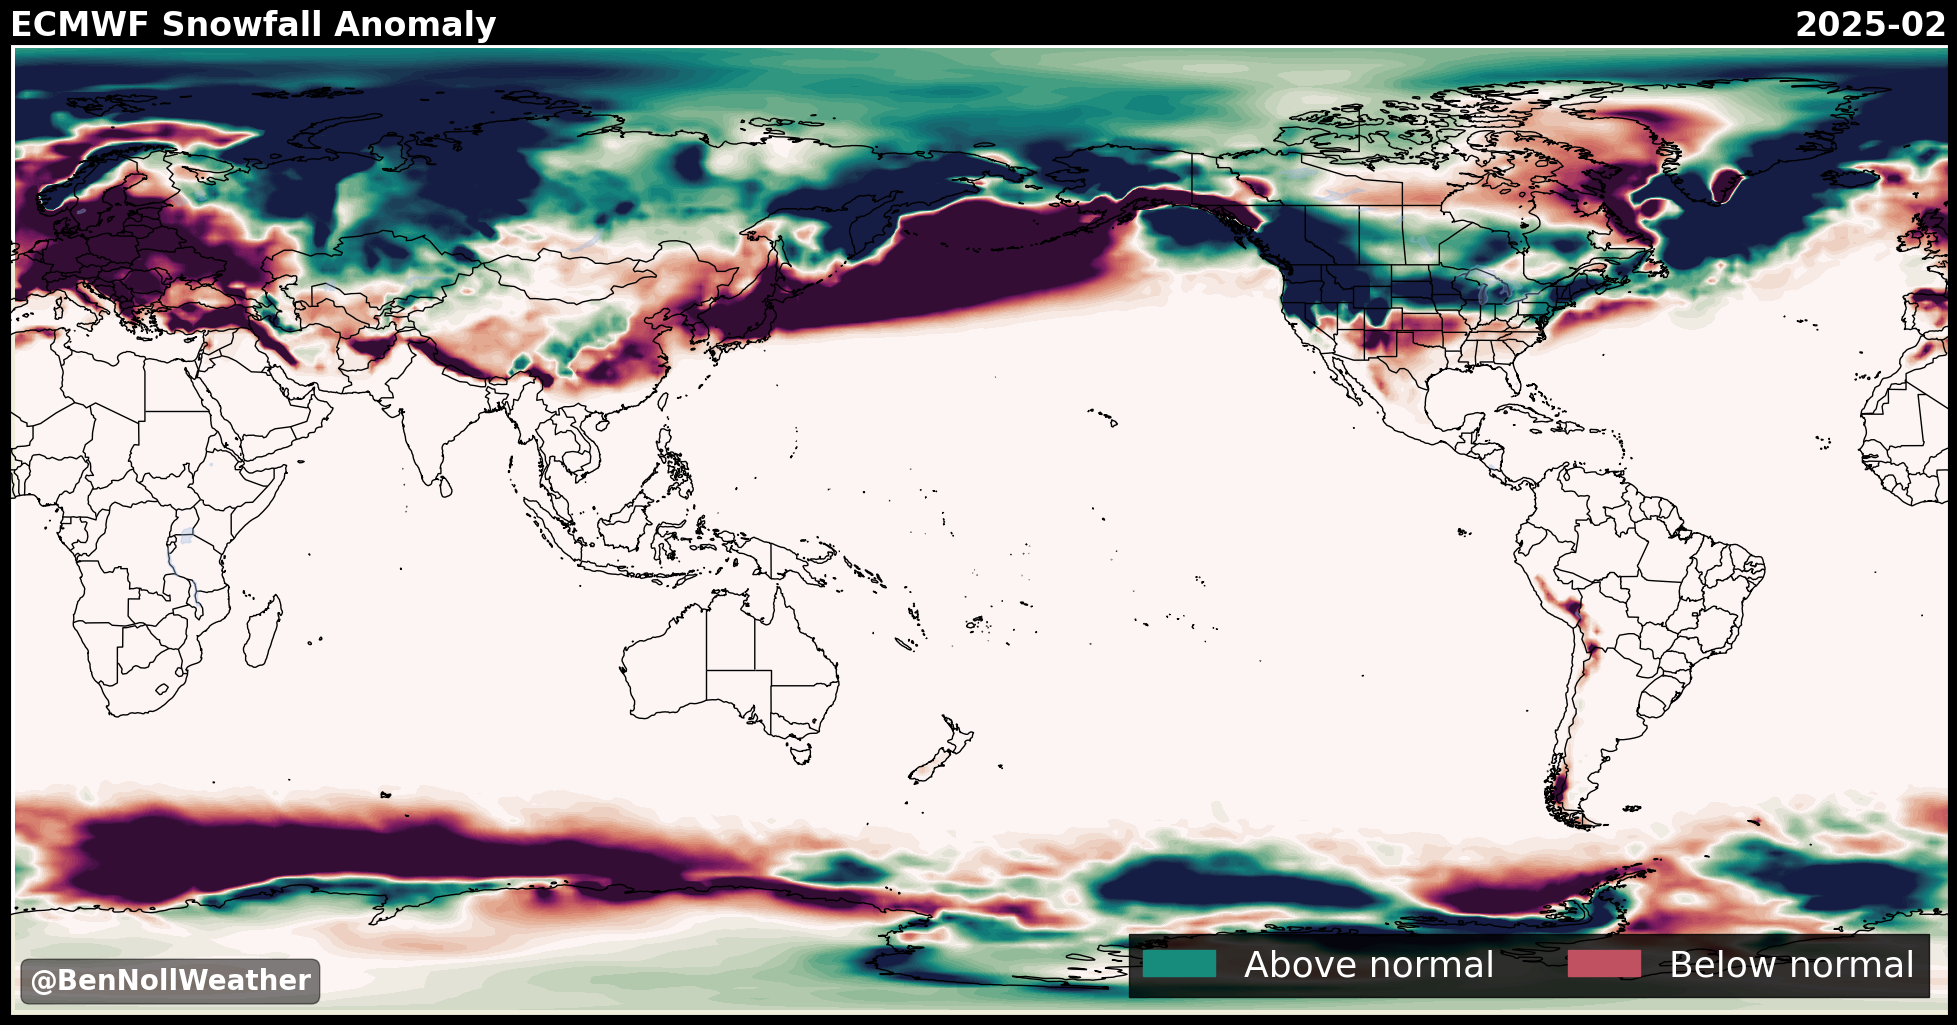
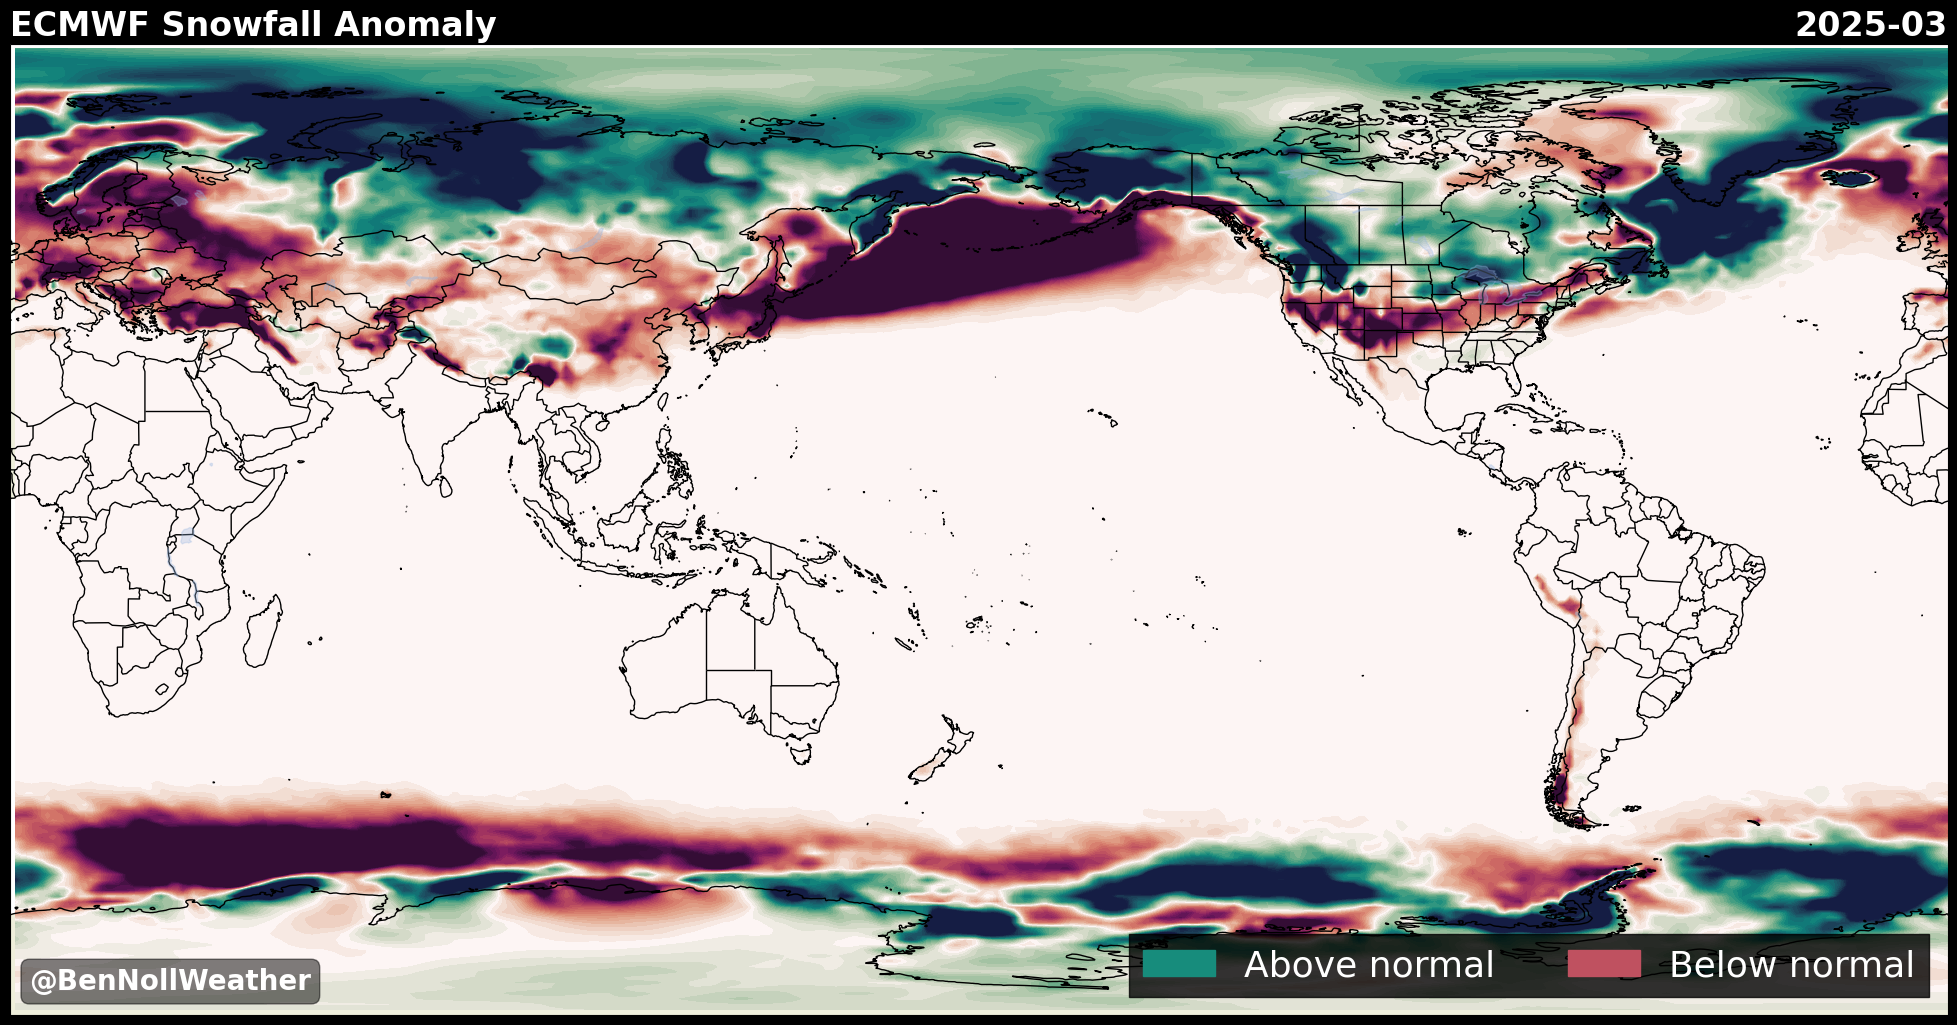
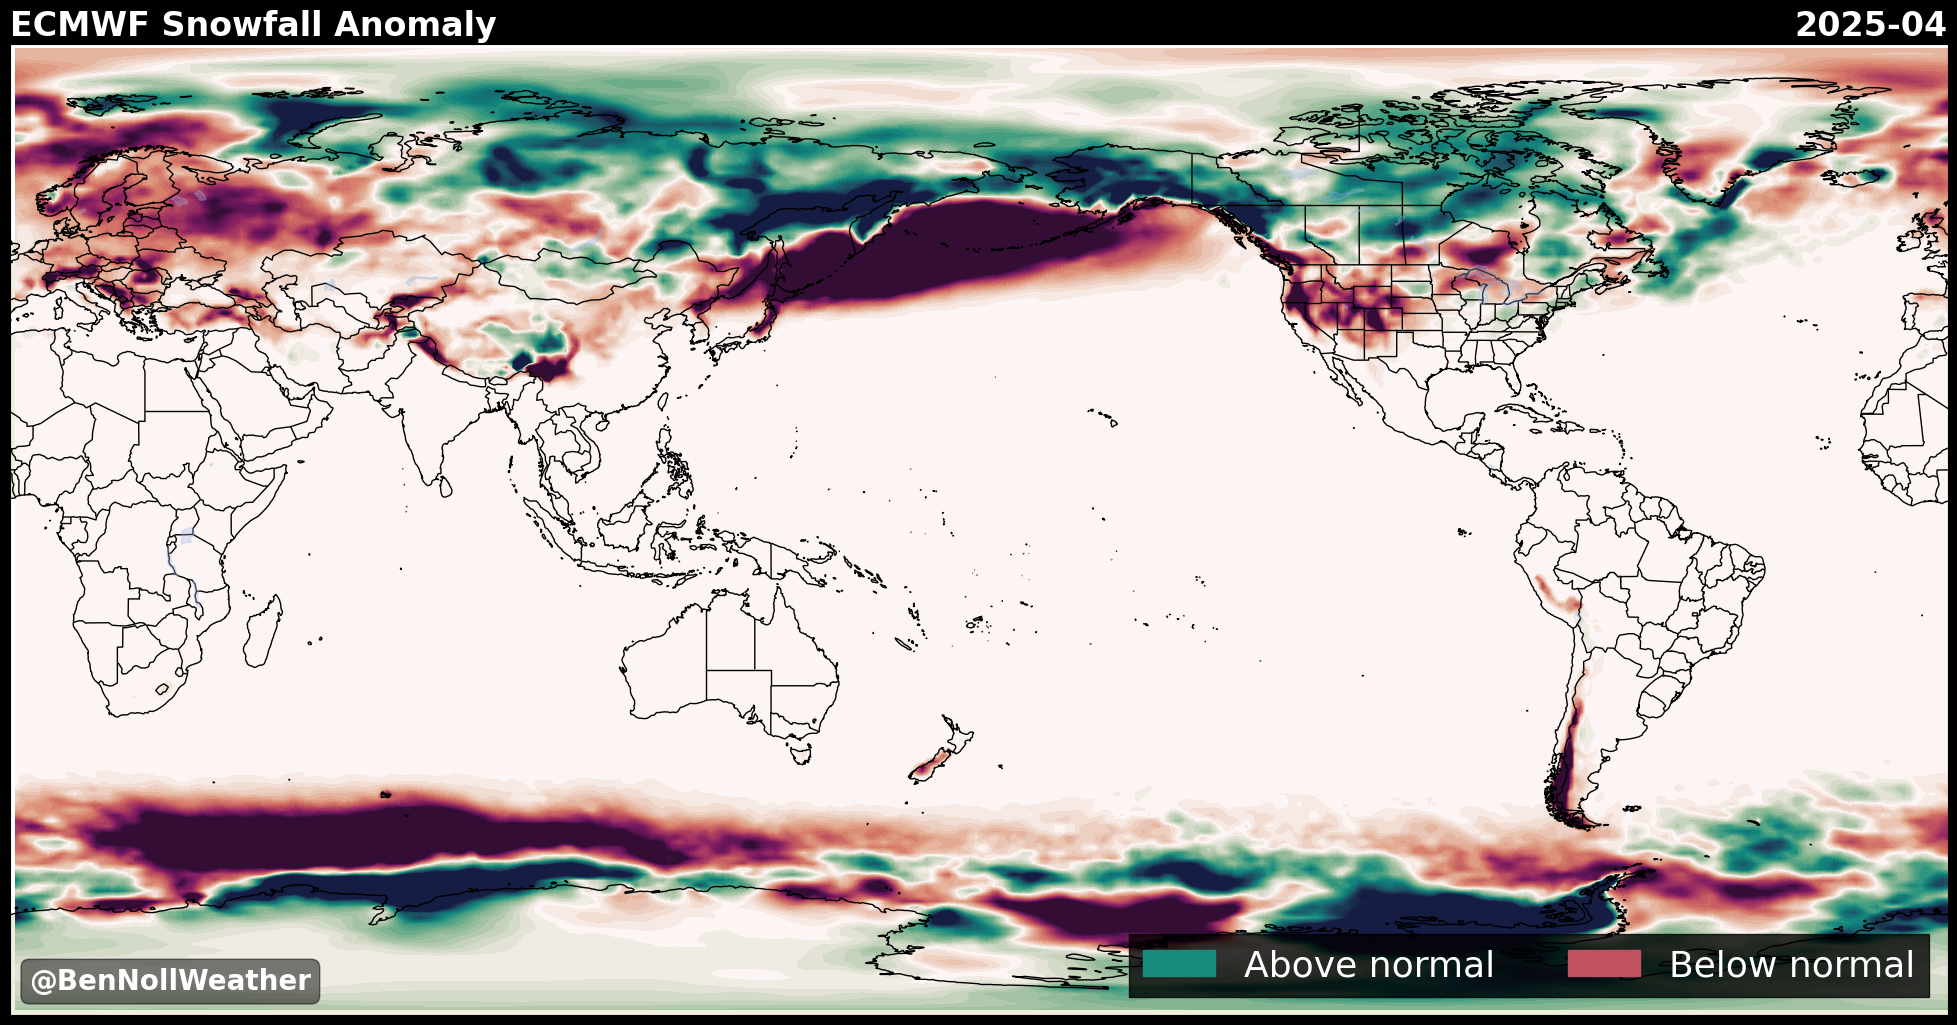
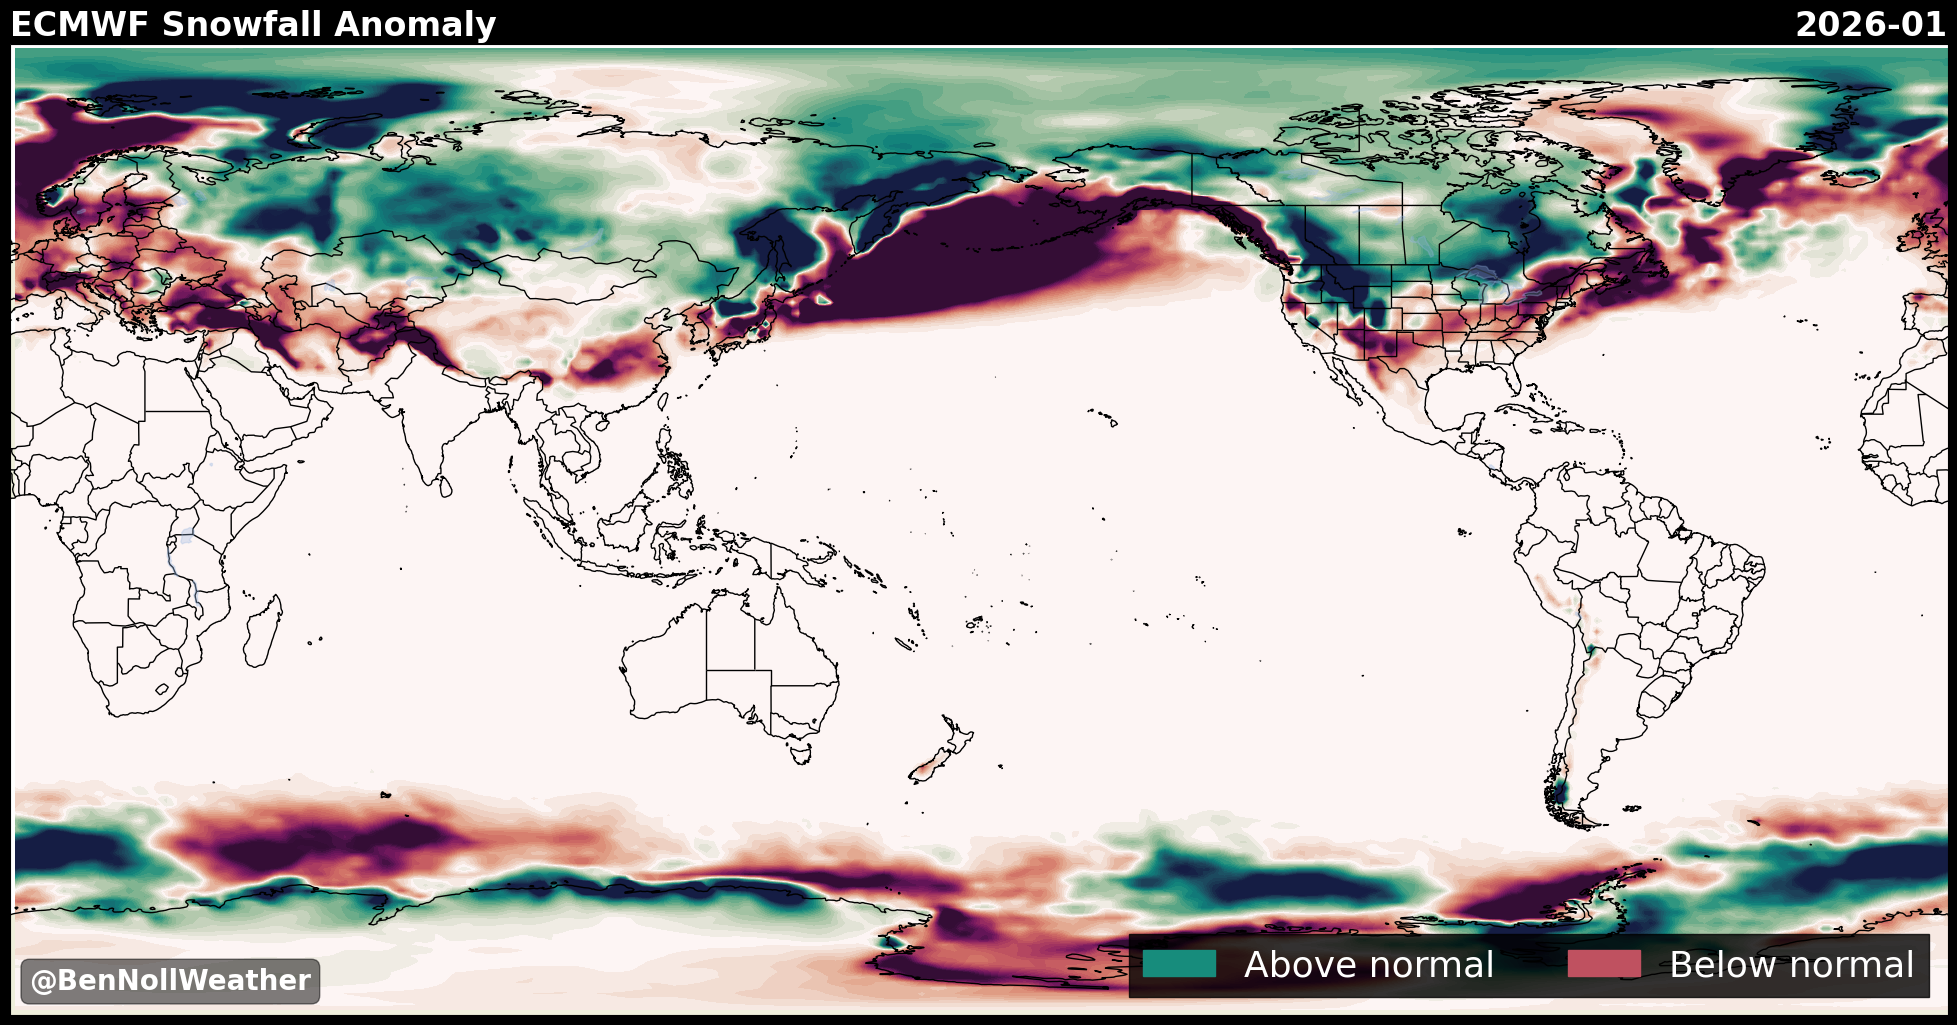
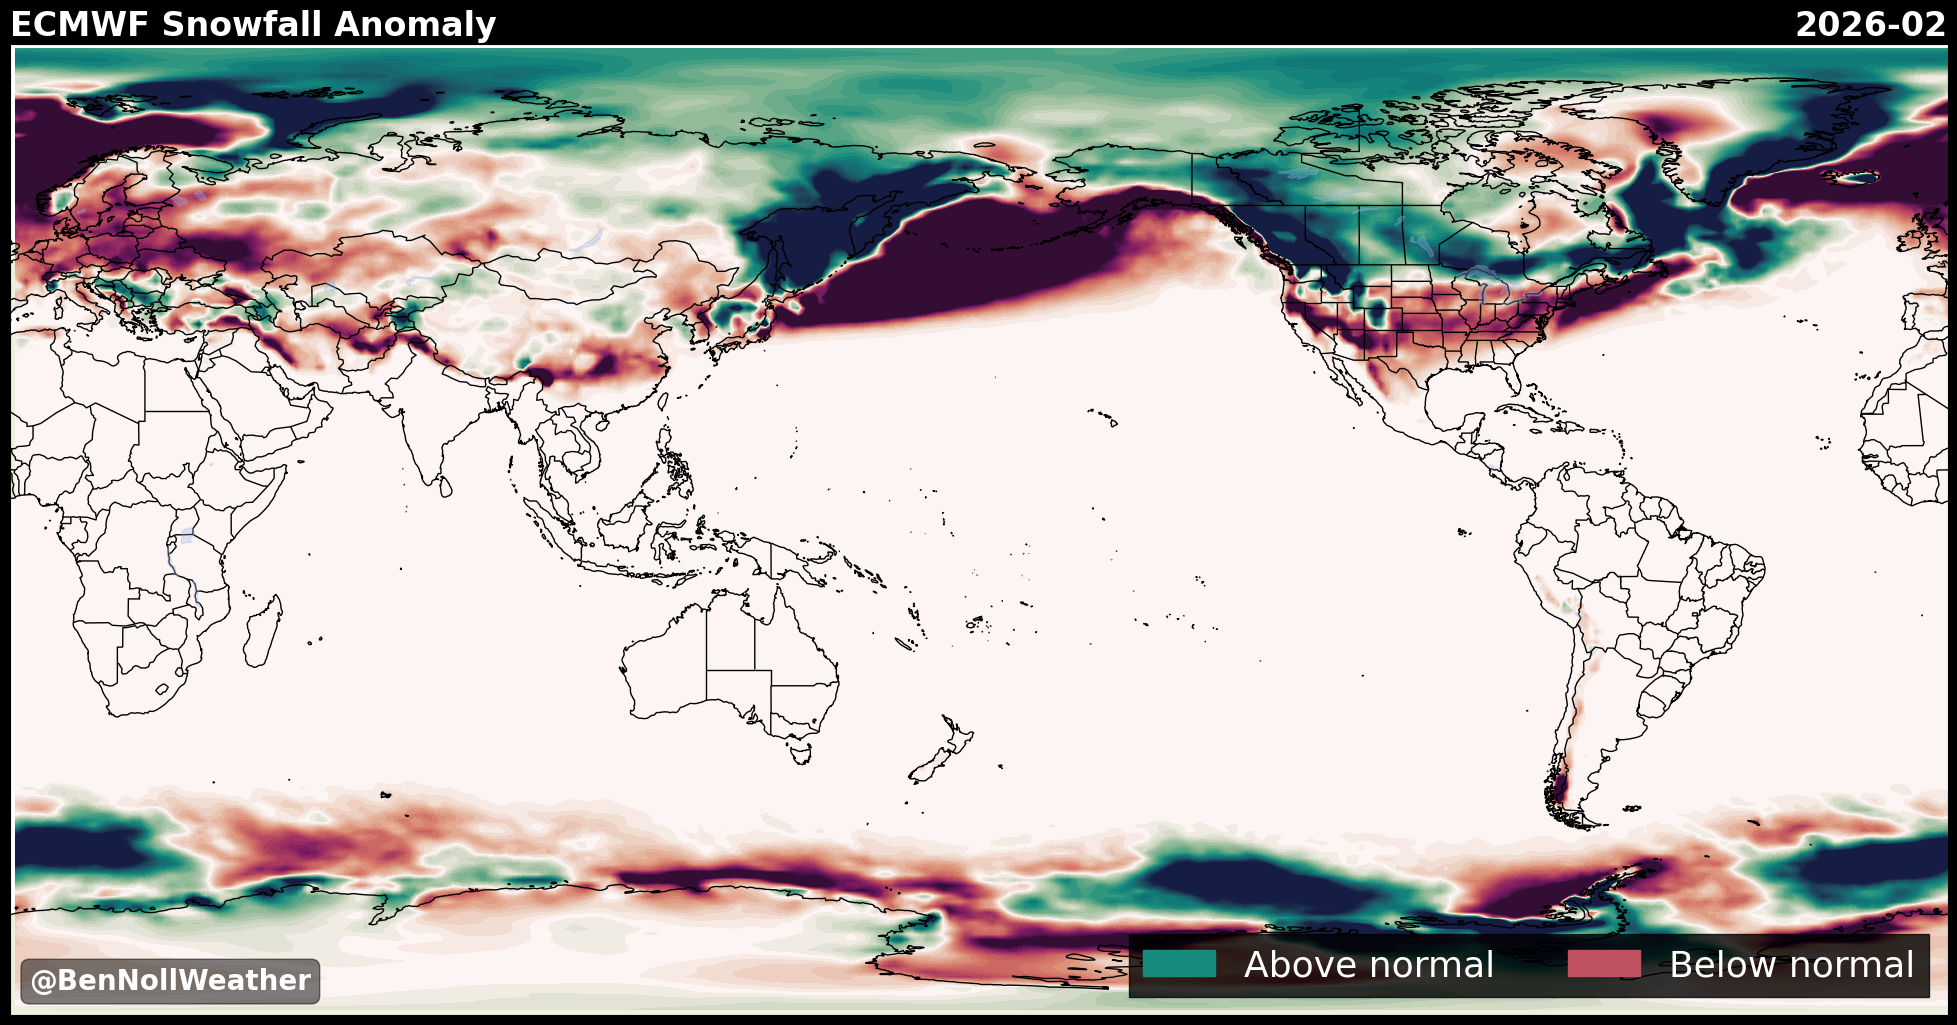
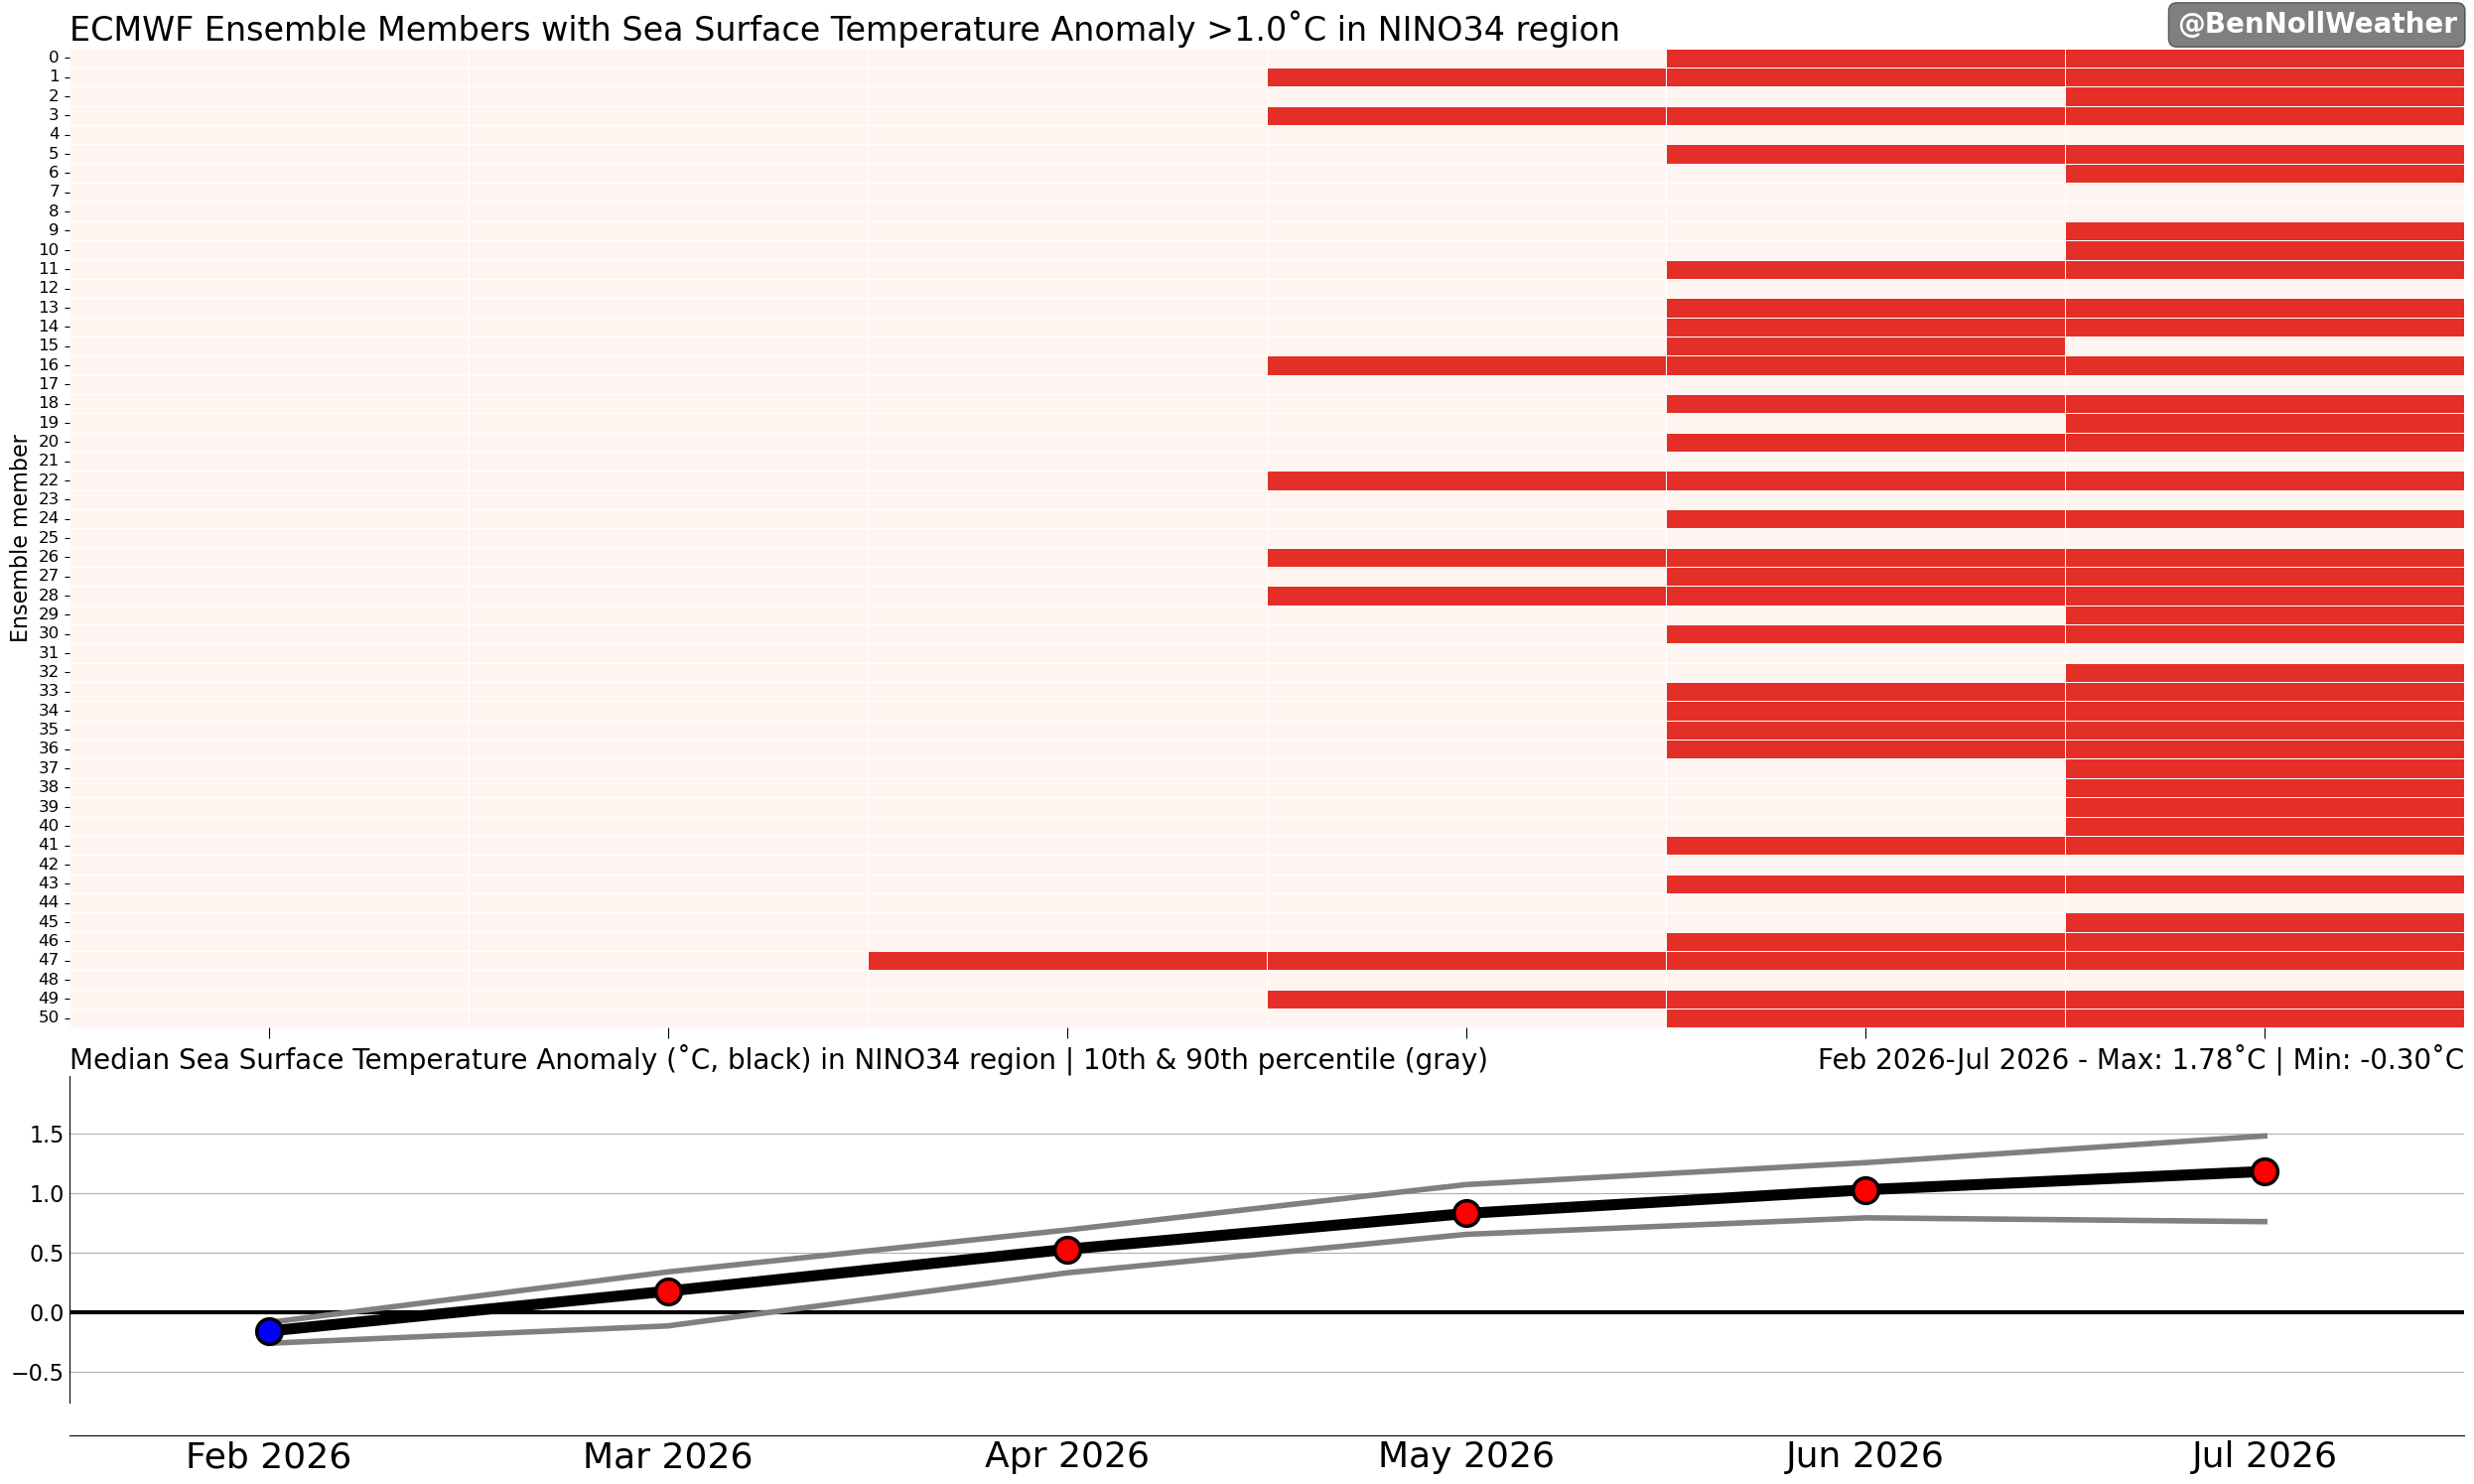
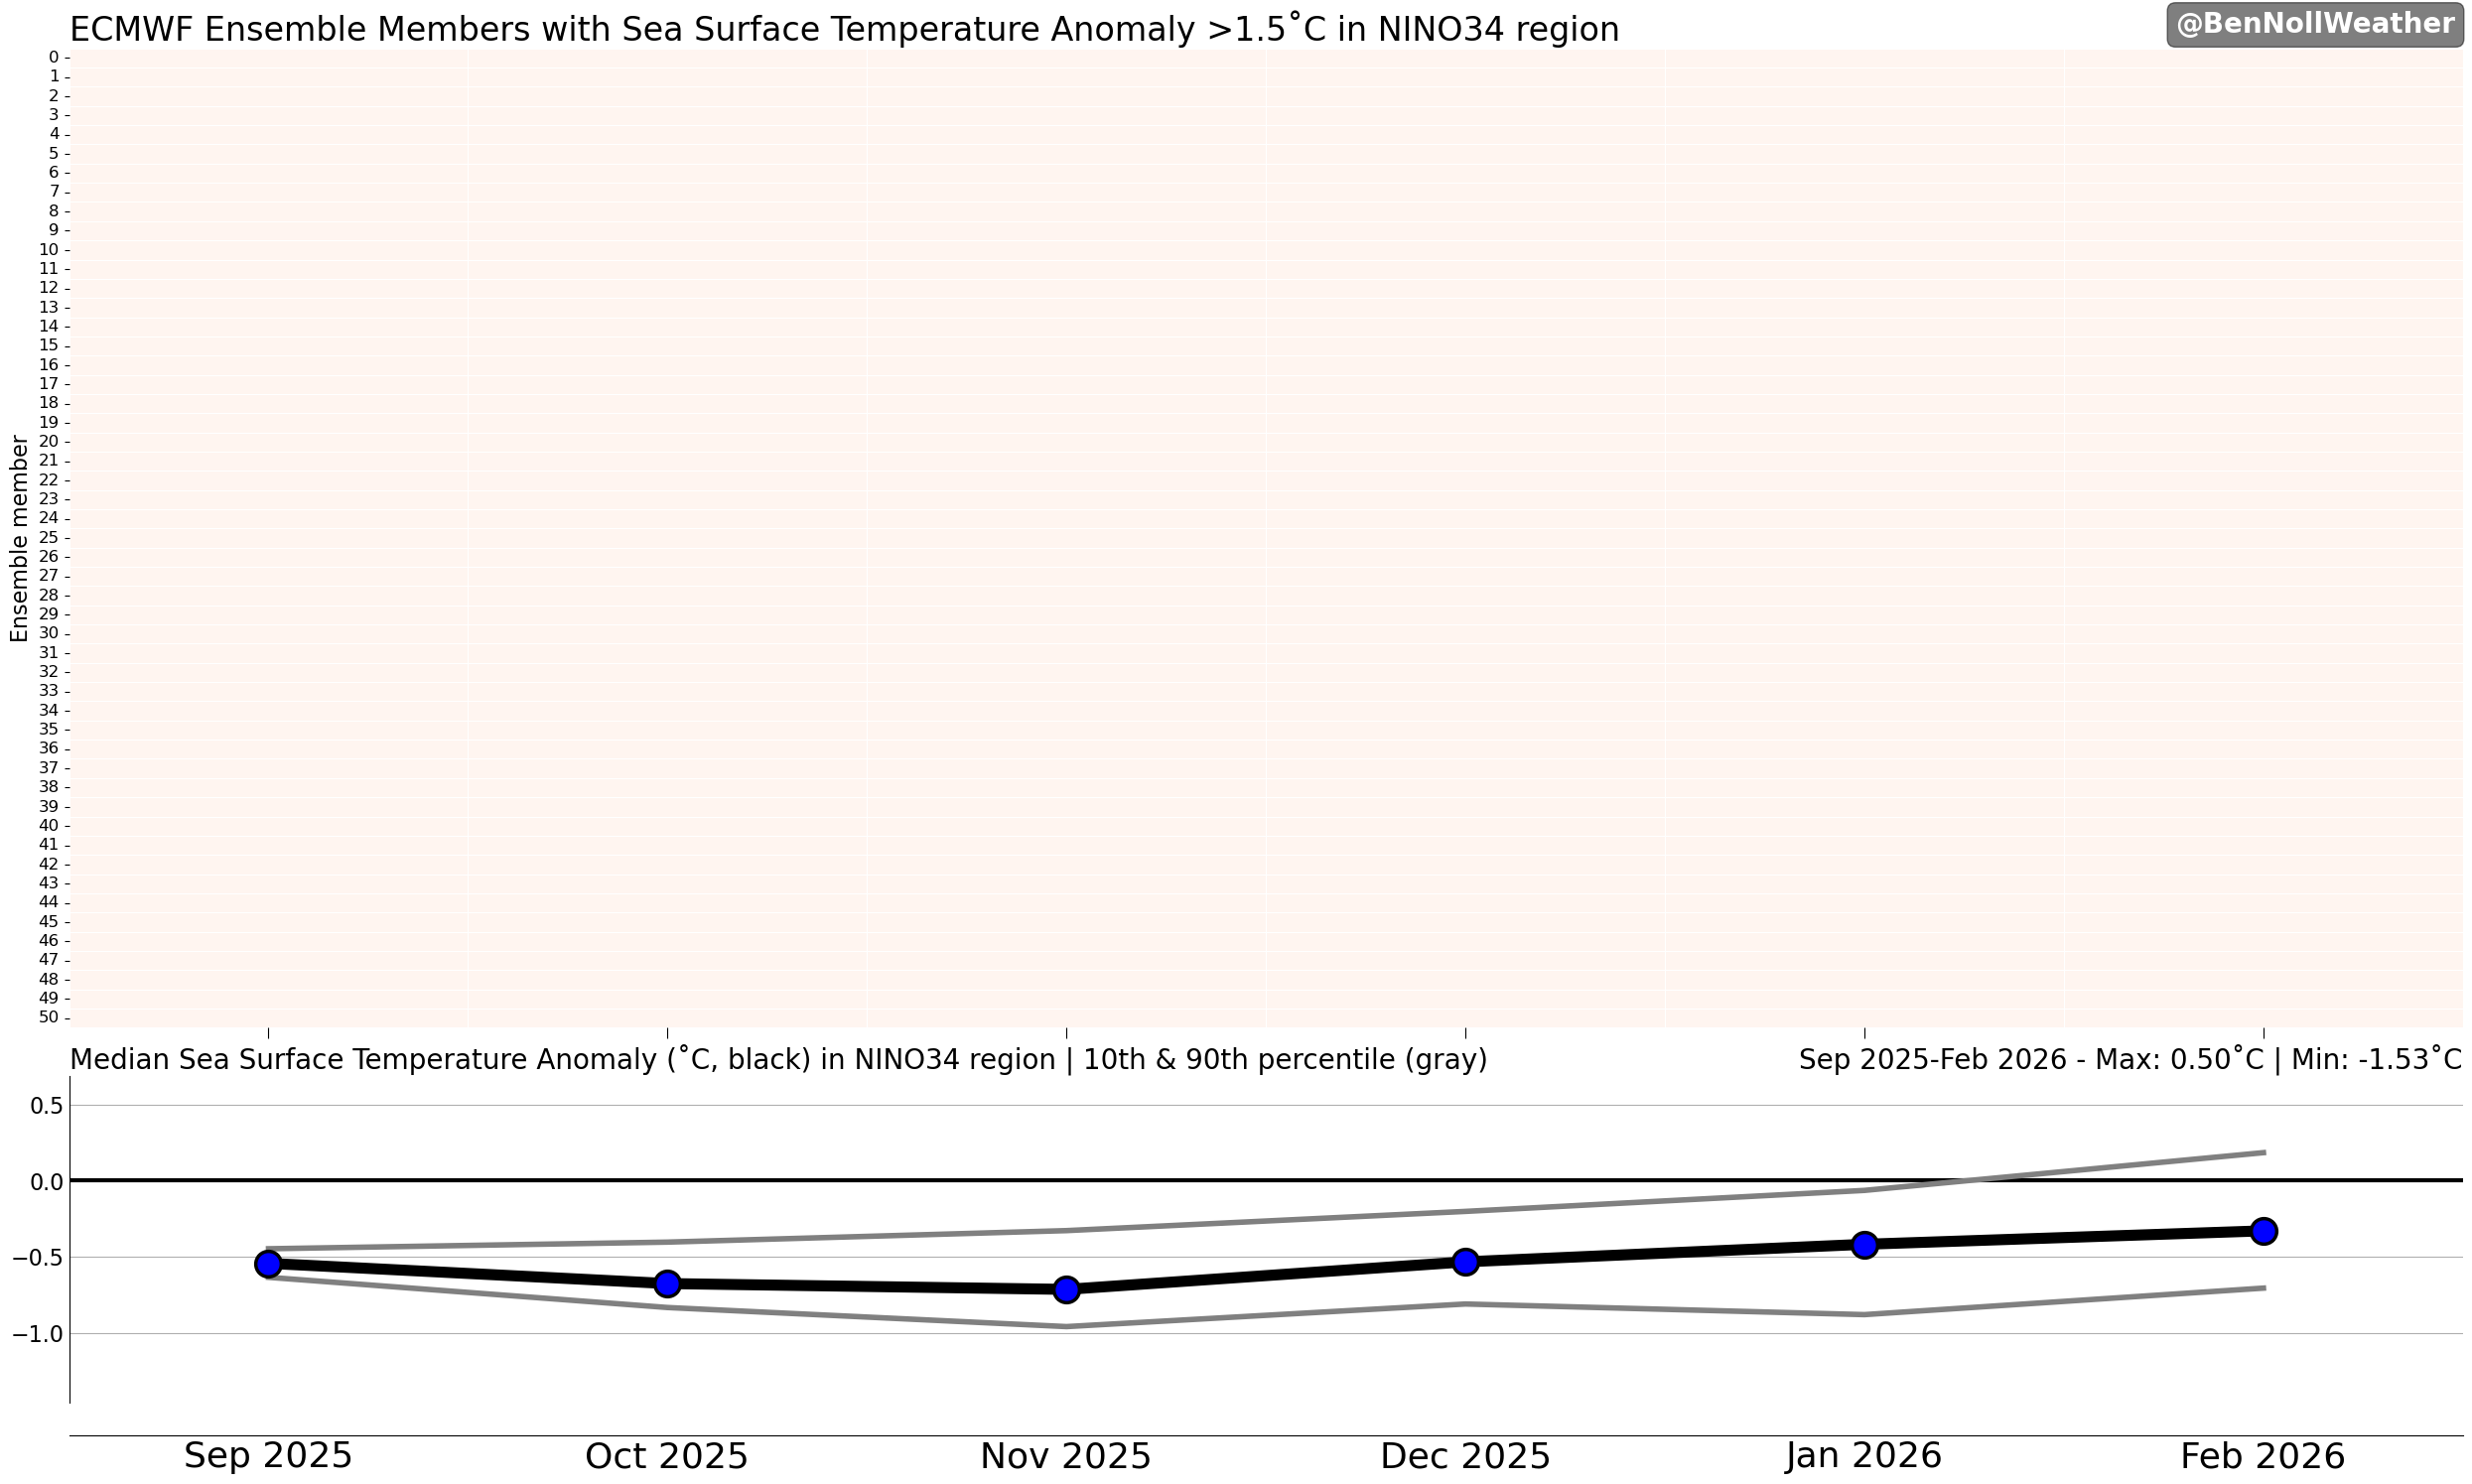
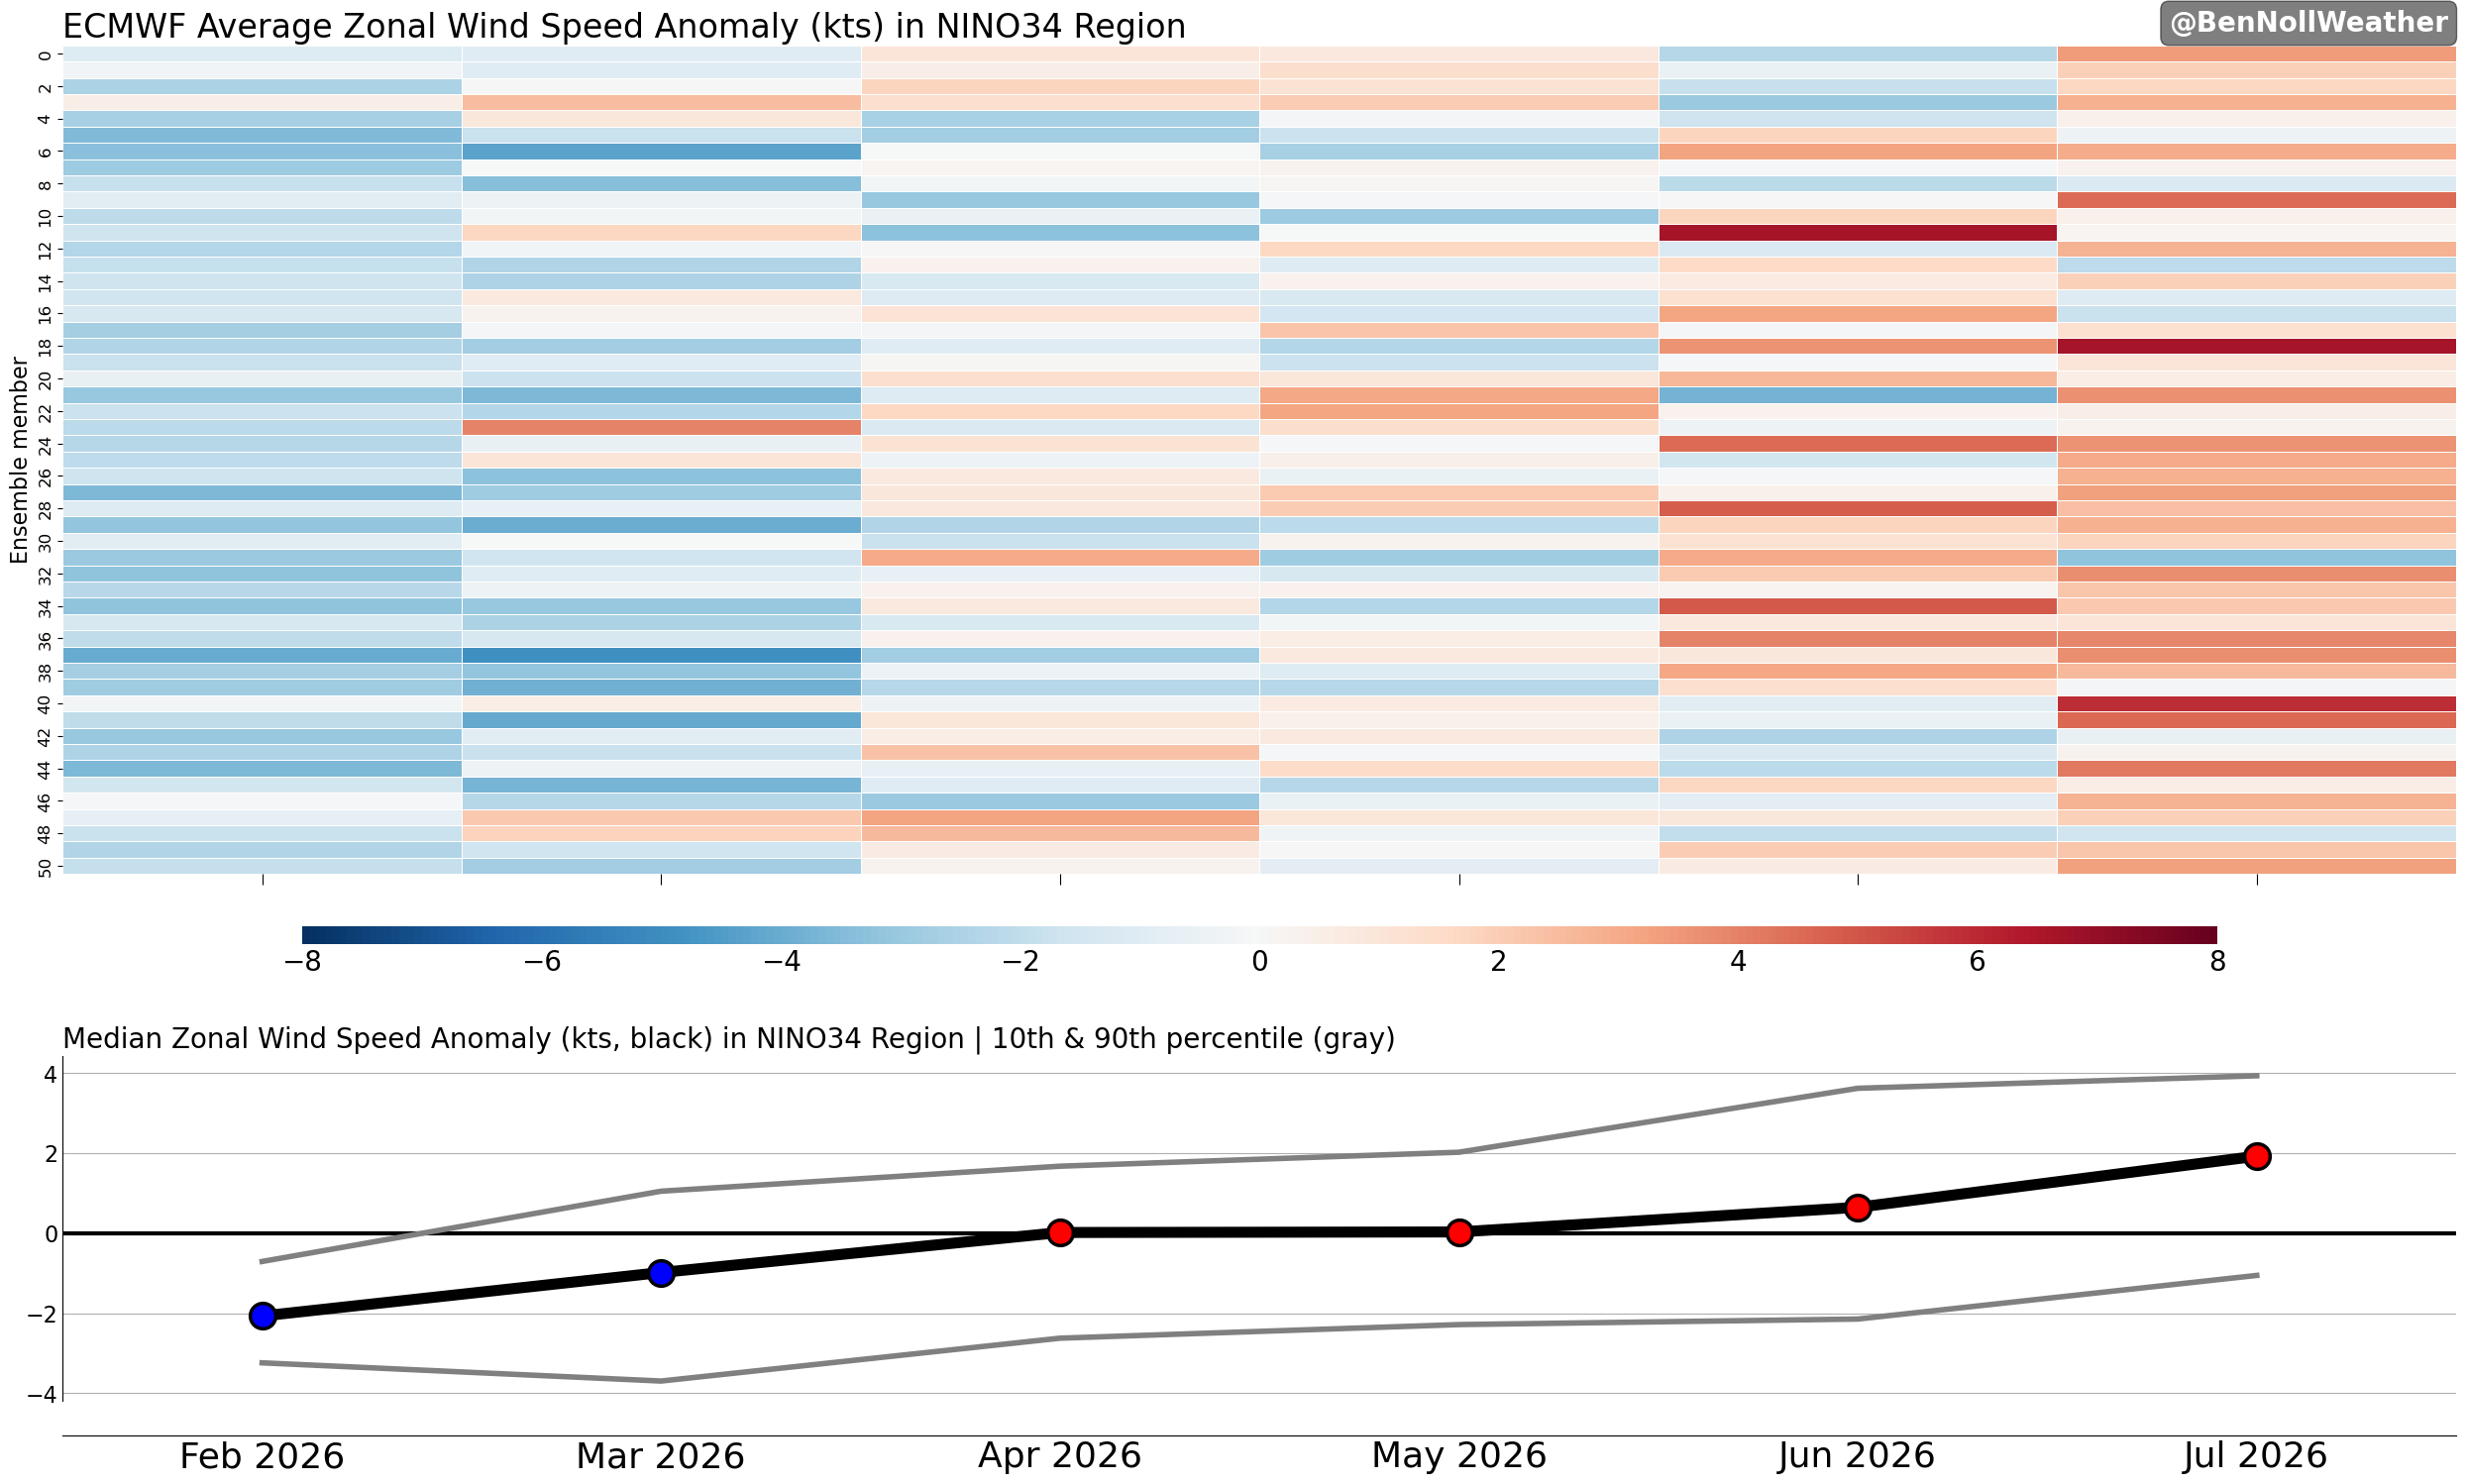
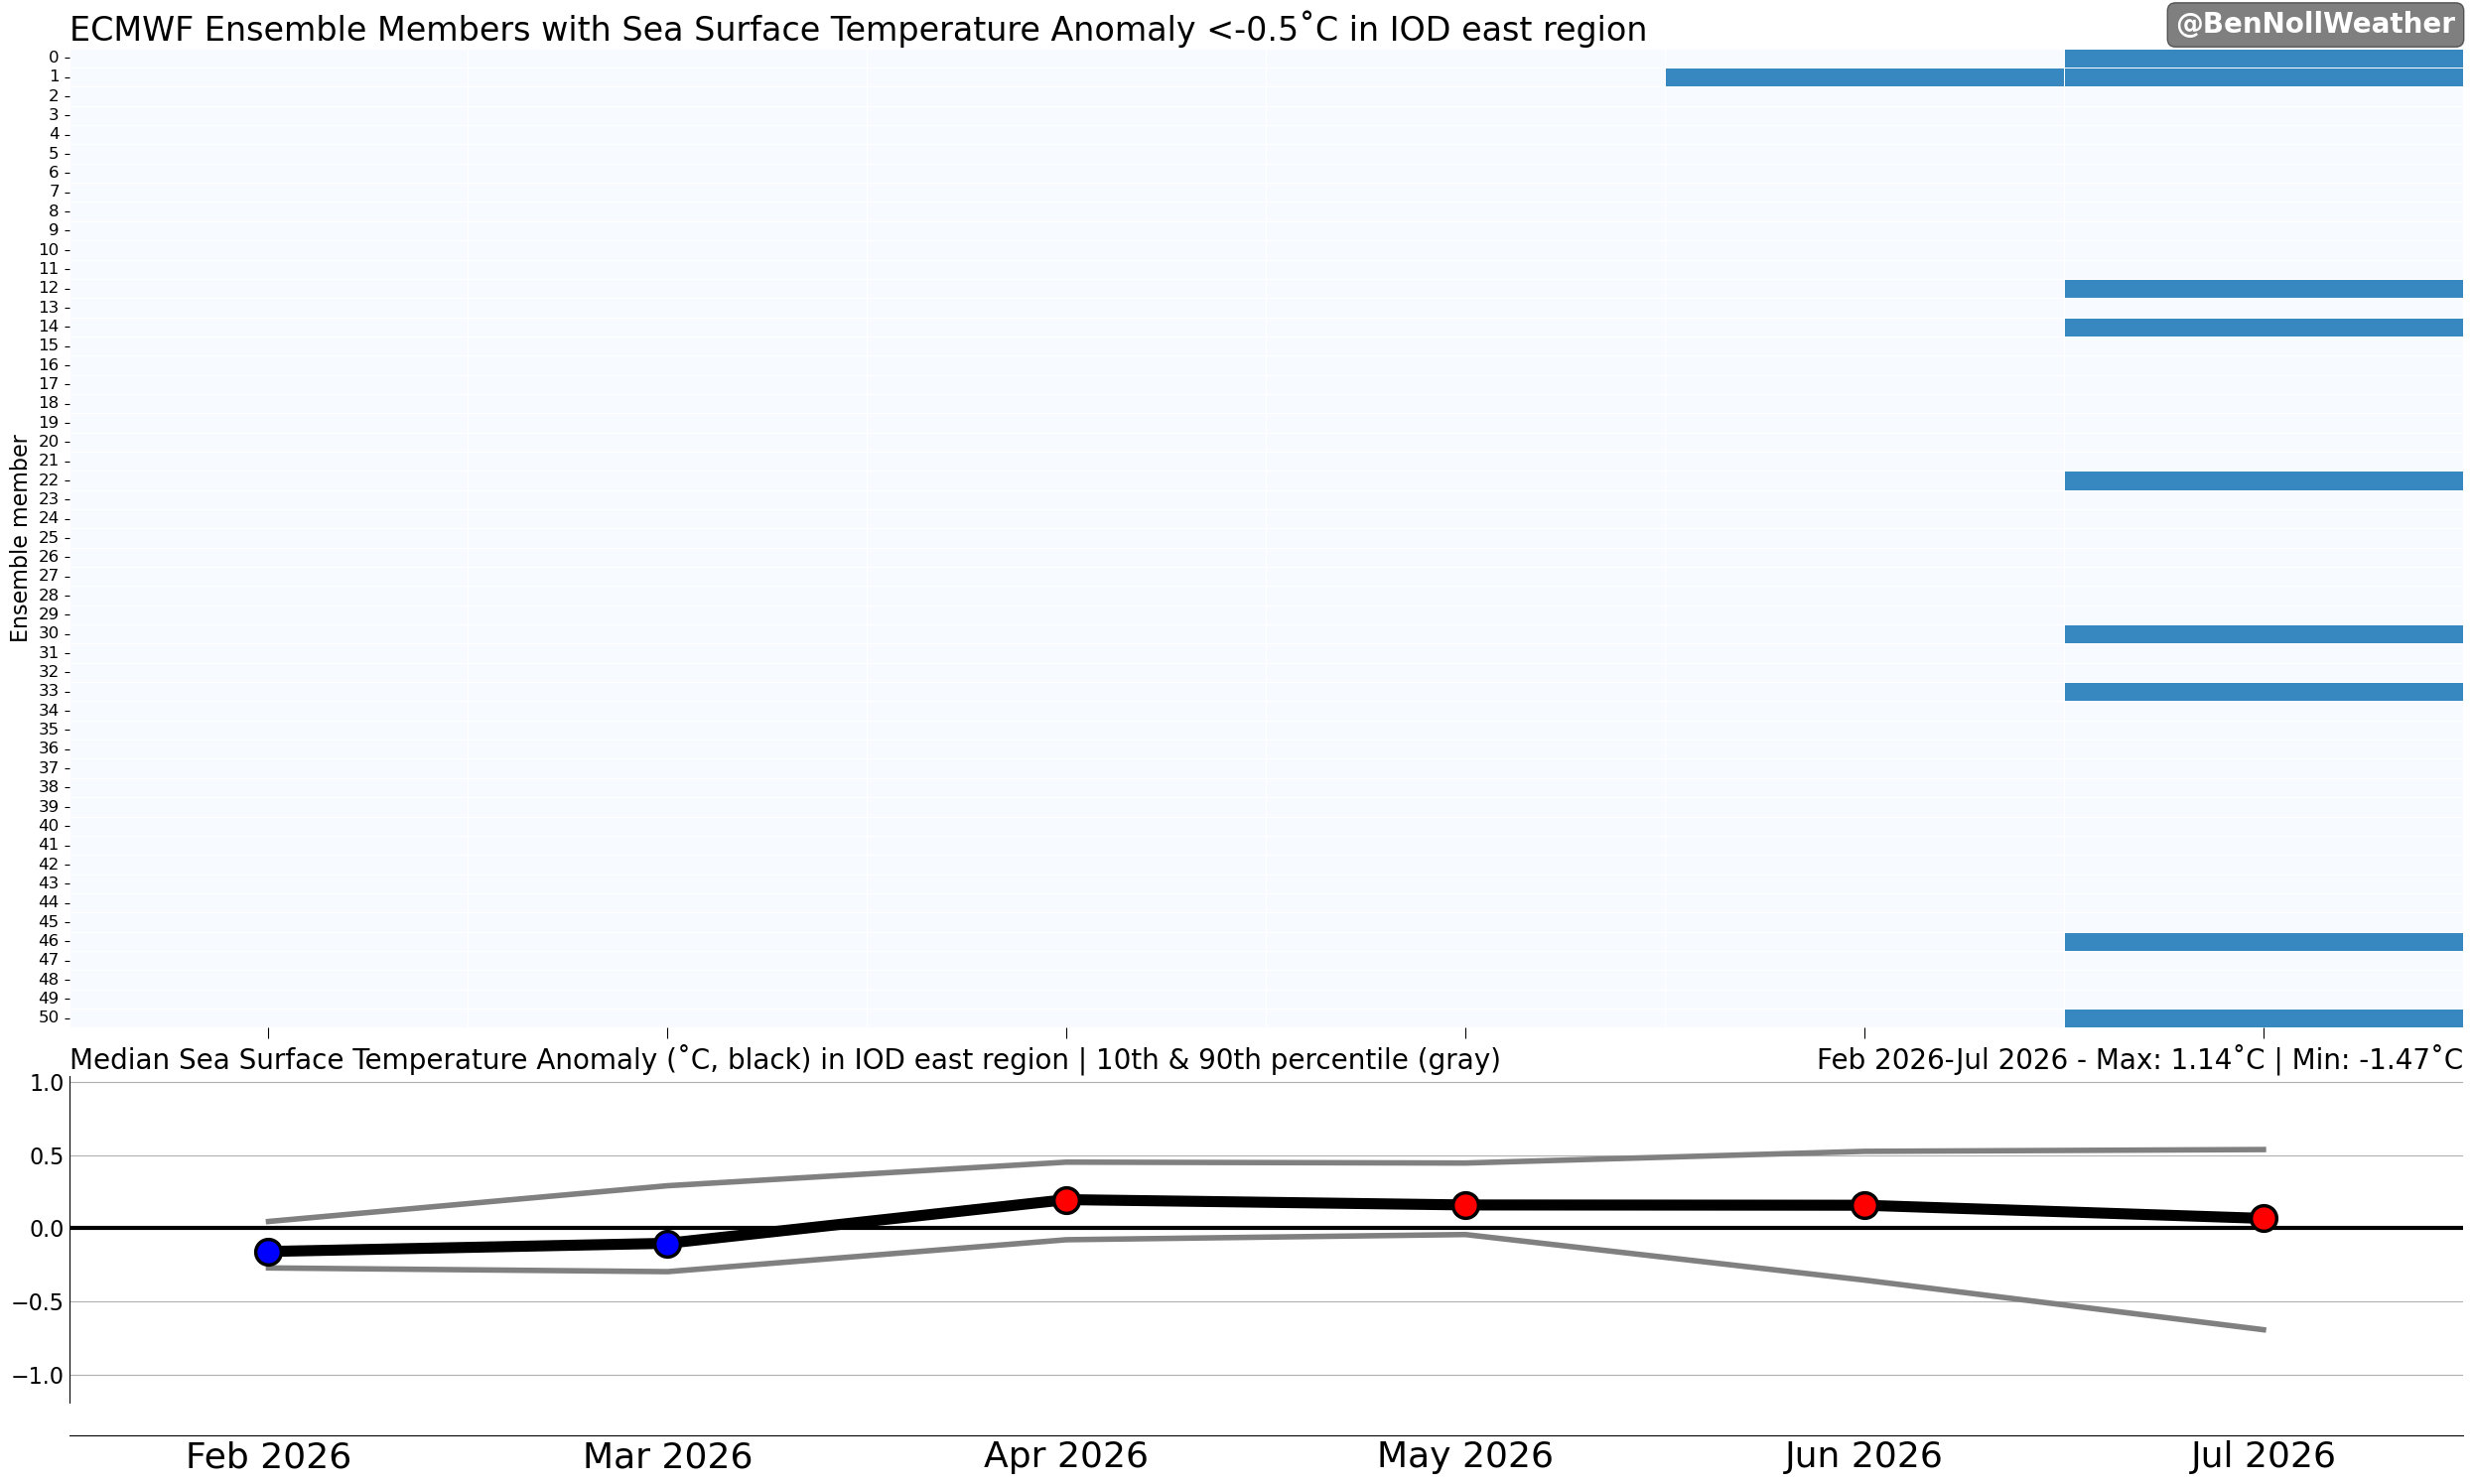
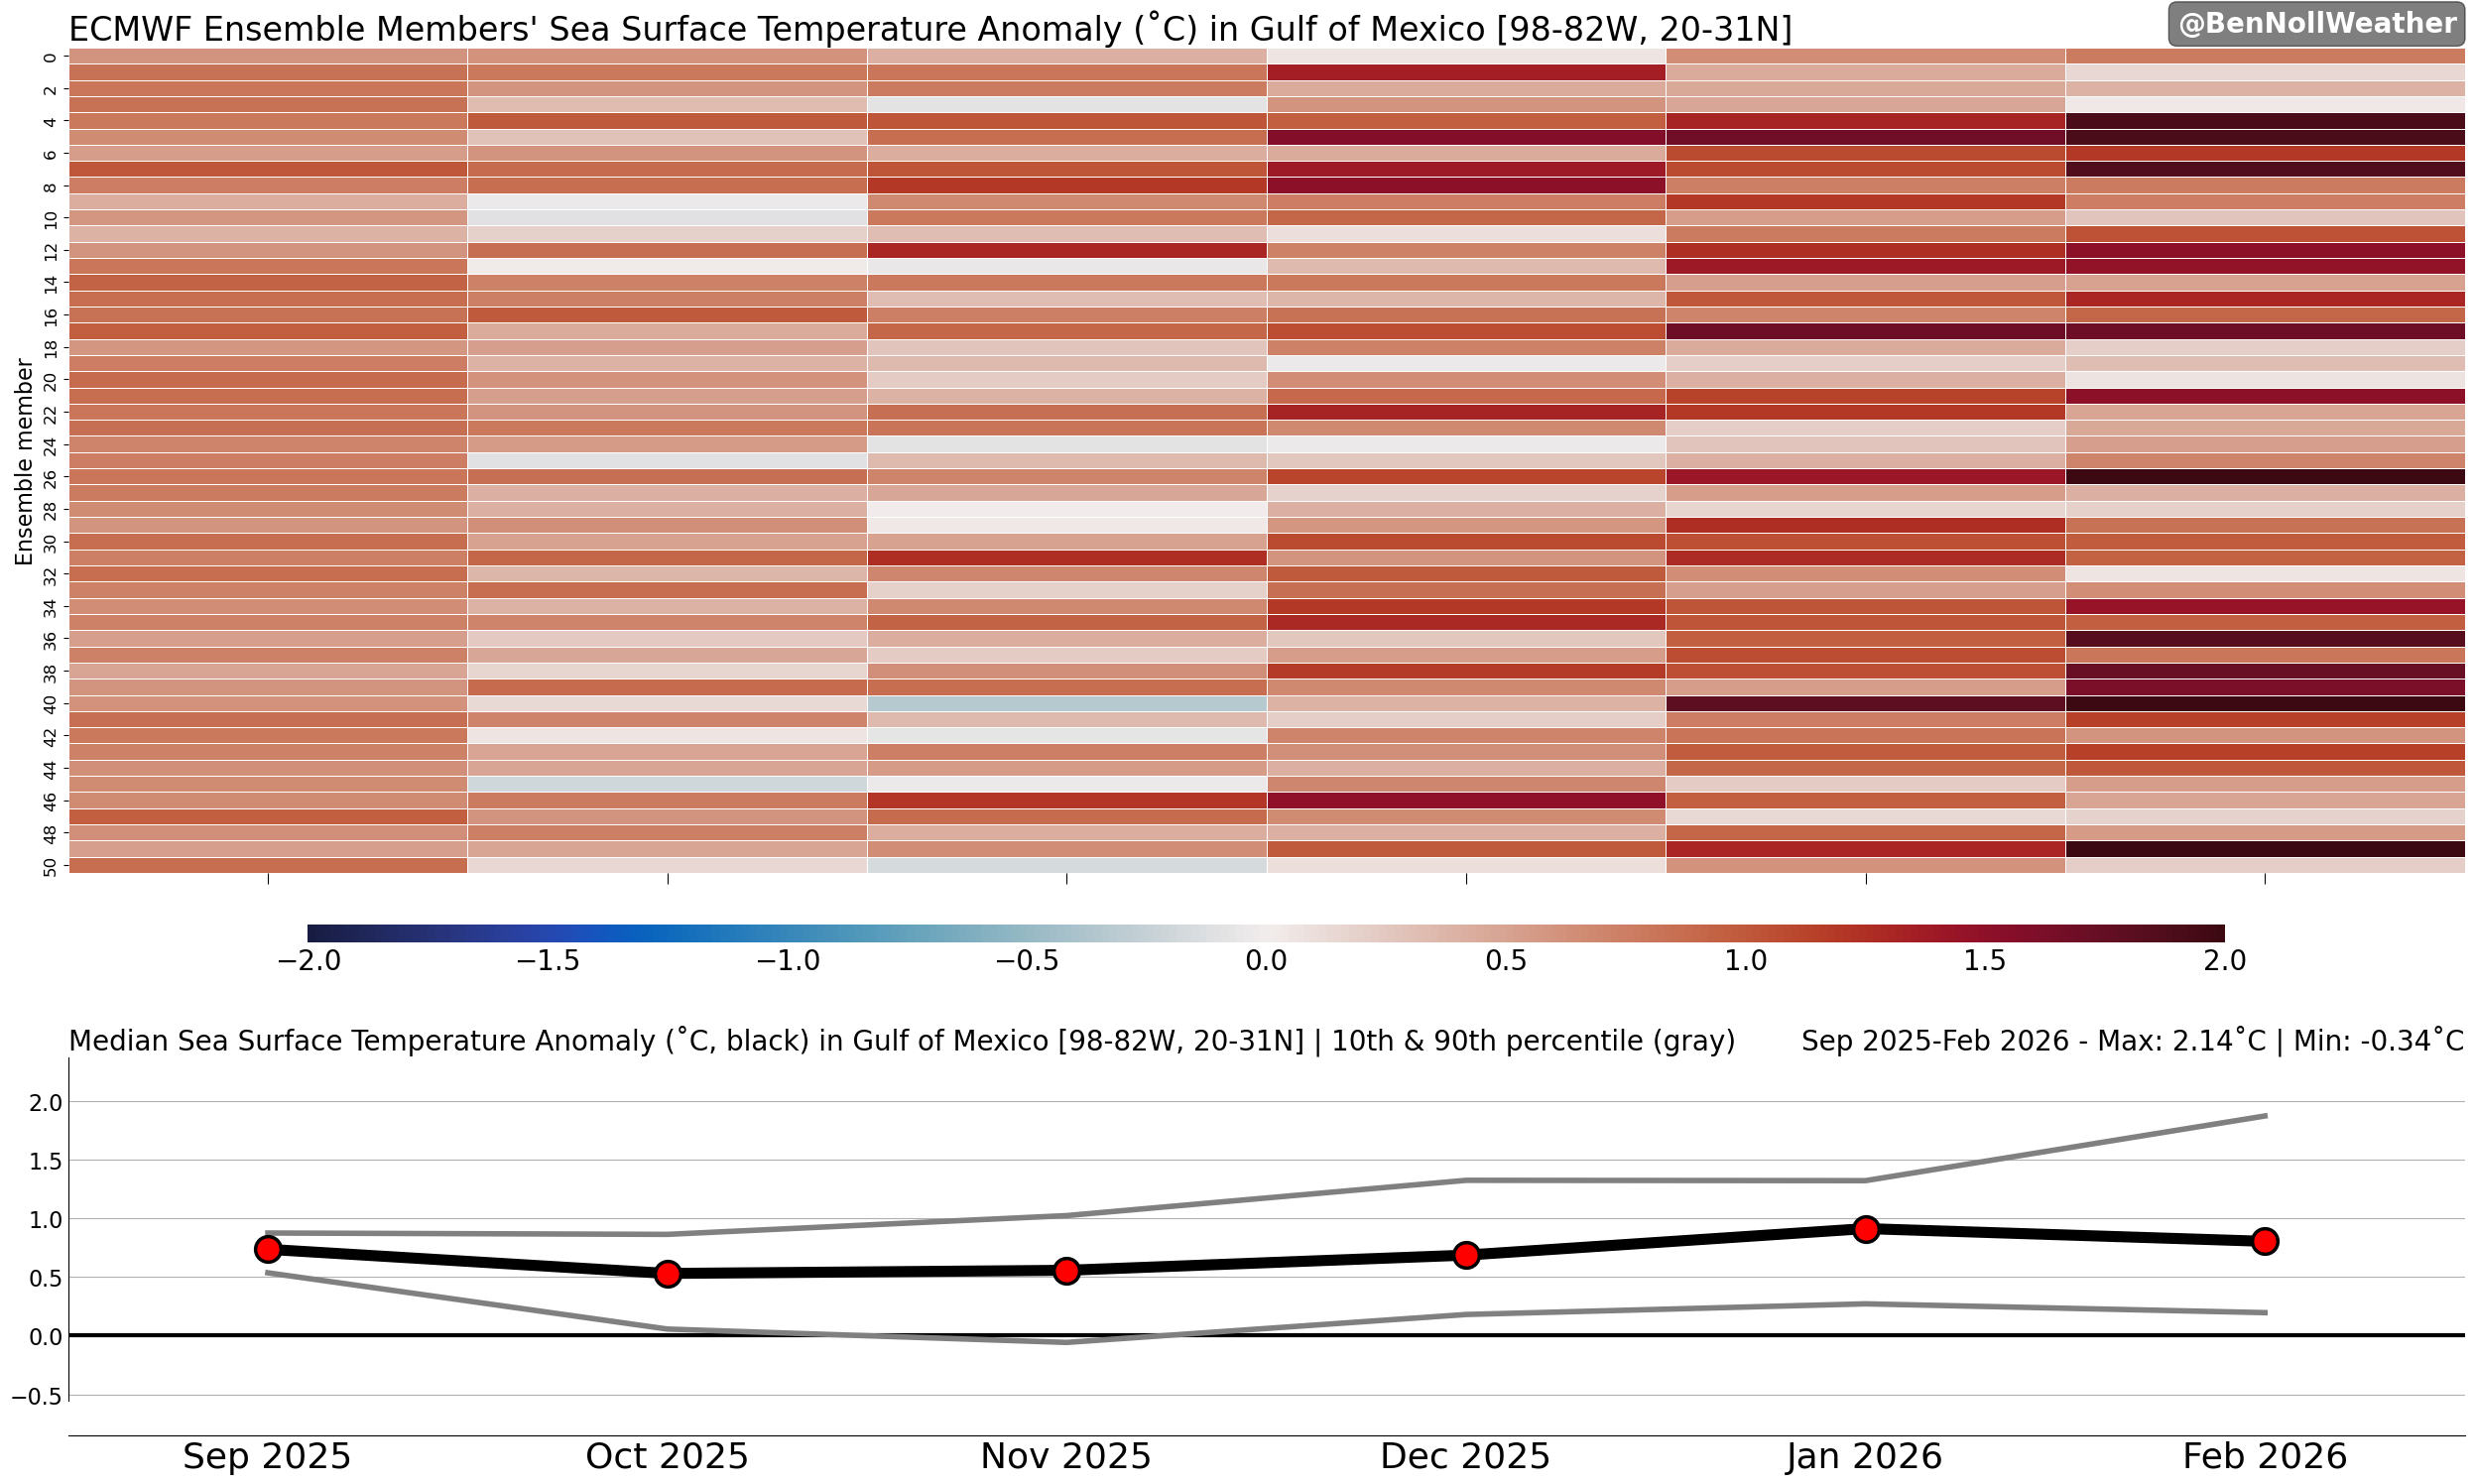
These graphics are generated by Ben Noll using data from the Copernicus Climate Change Service (C3S). The C3S (ECMWF) imagery updates once a month around the 10th (6th) and provides insights on general climatic patterns for the next six months. Unless otherwise stated, anomalies are computed with respect to the 1993-2016 long-term mean. You are welcome to use the imagery with proper credit.
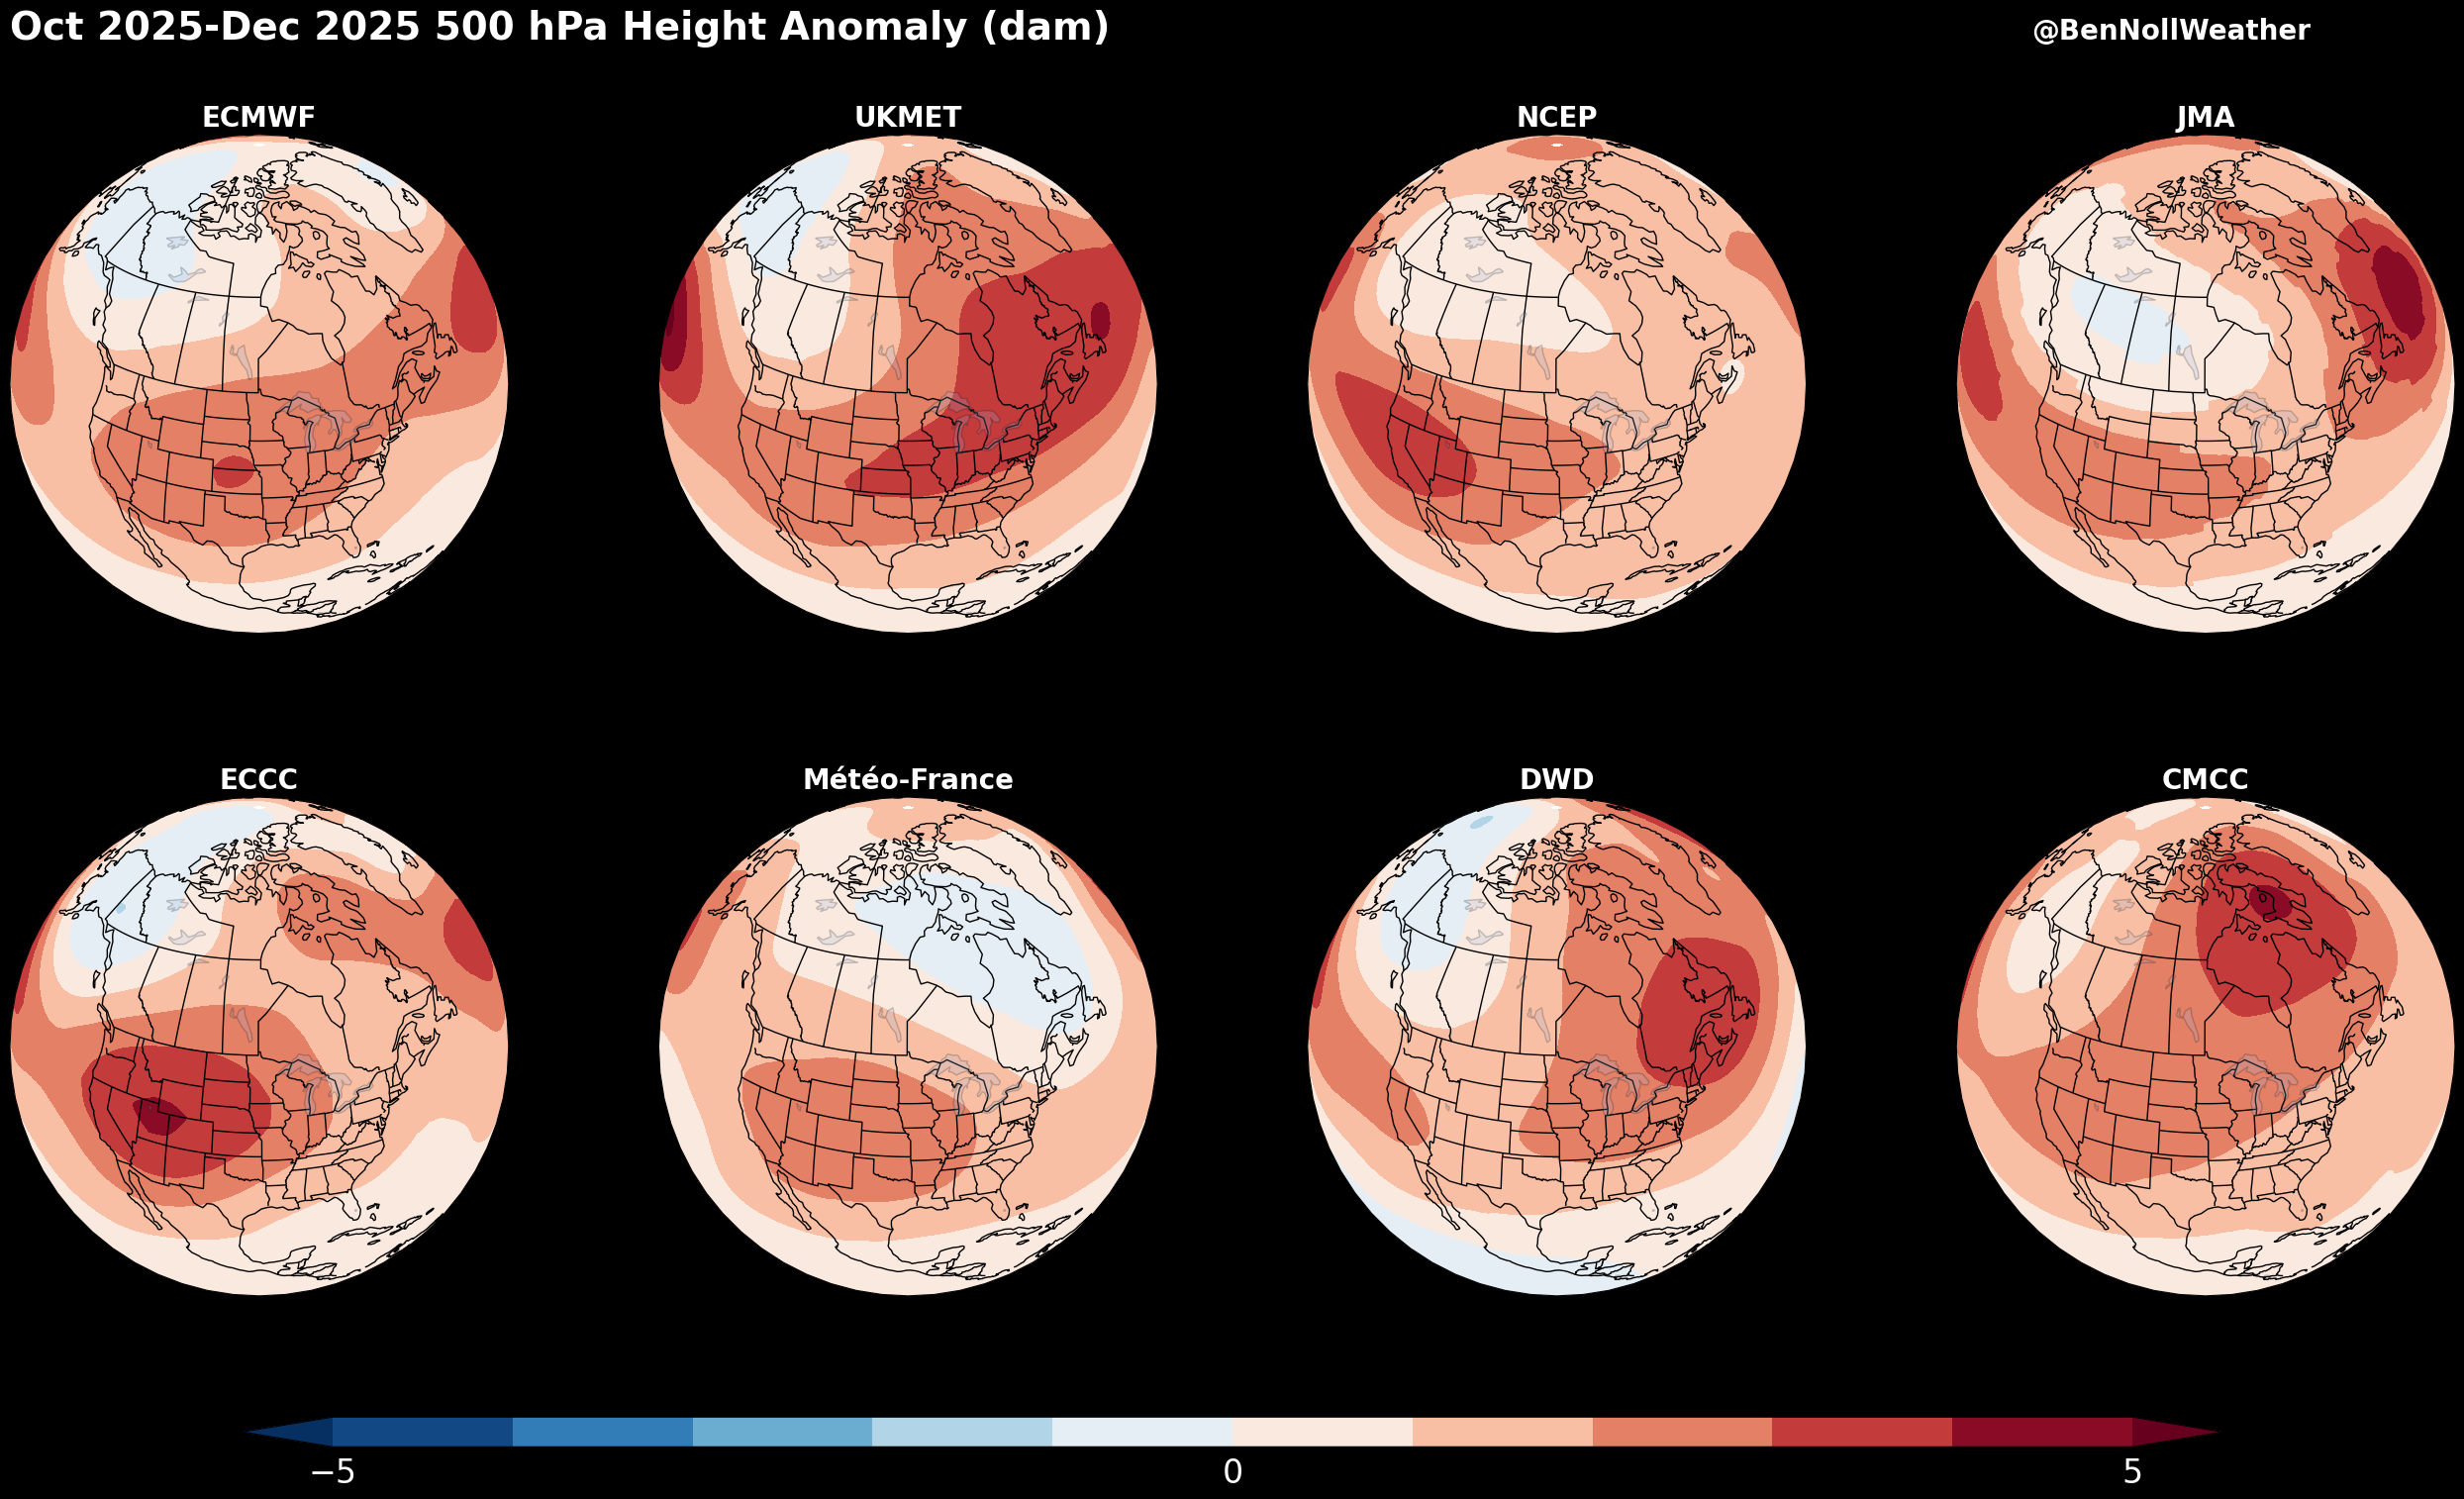
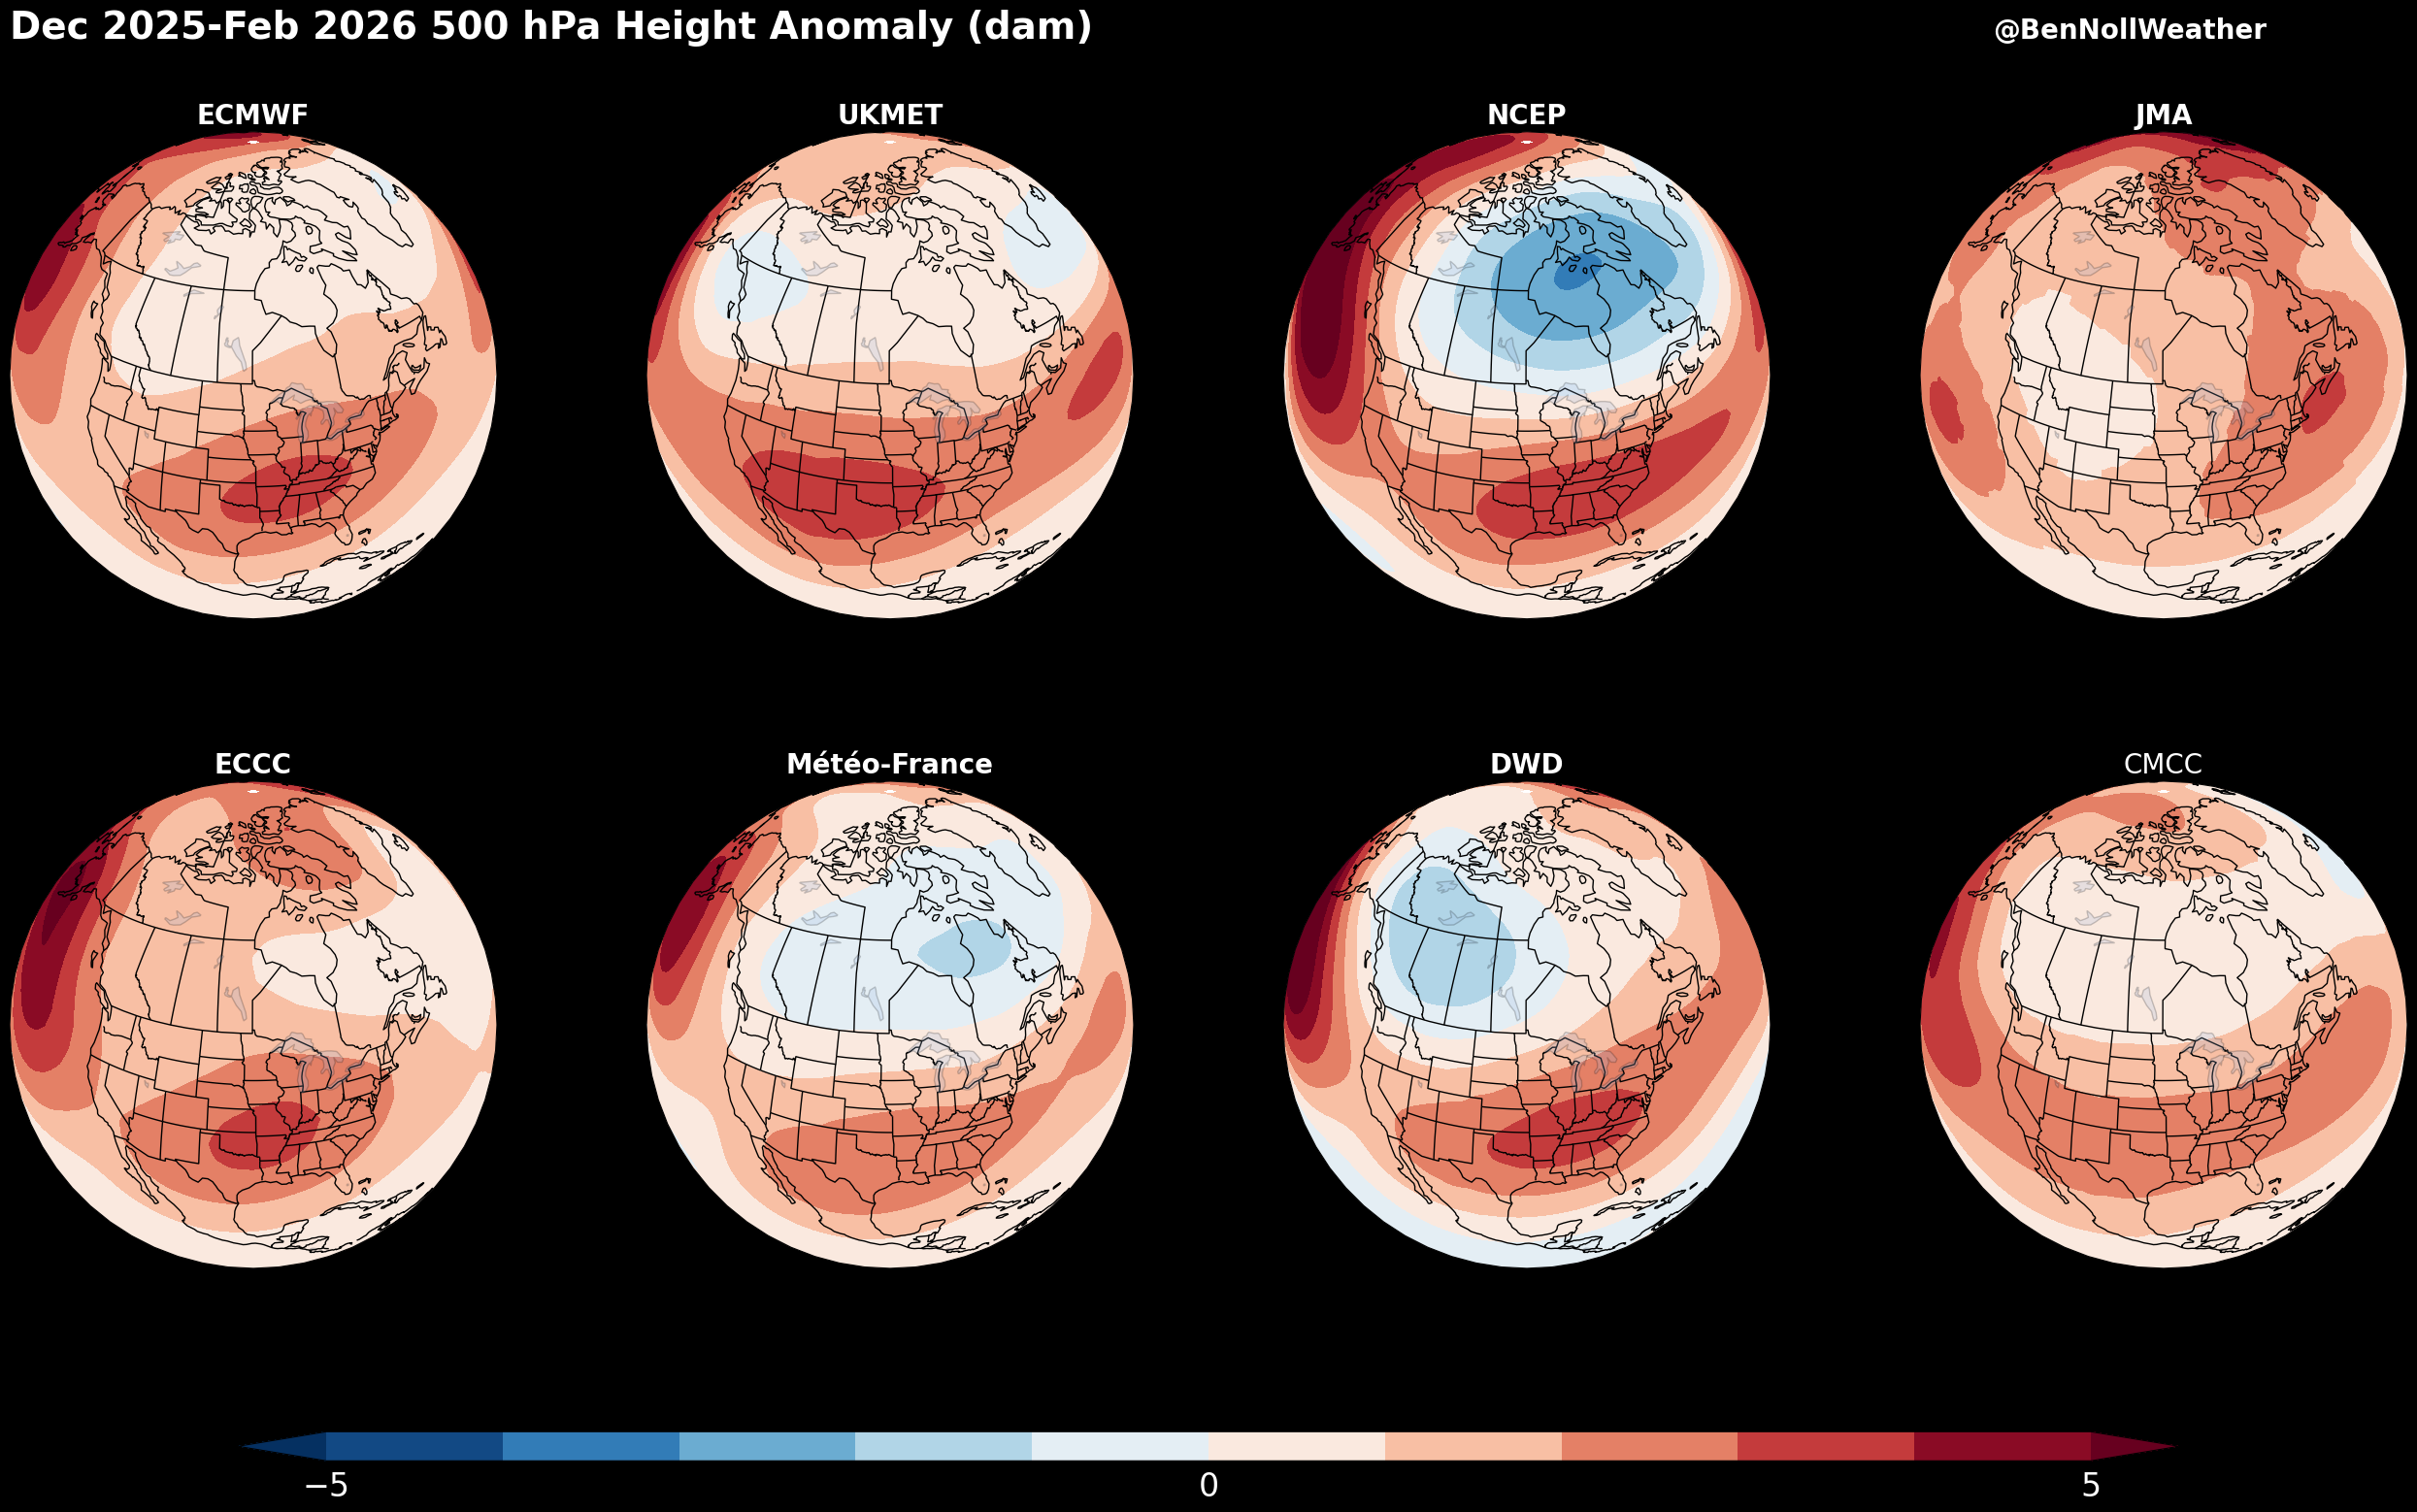


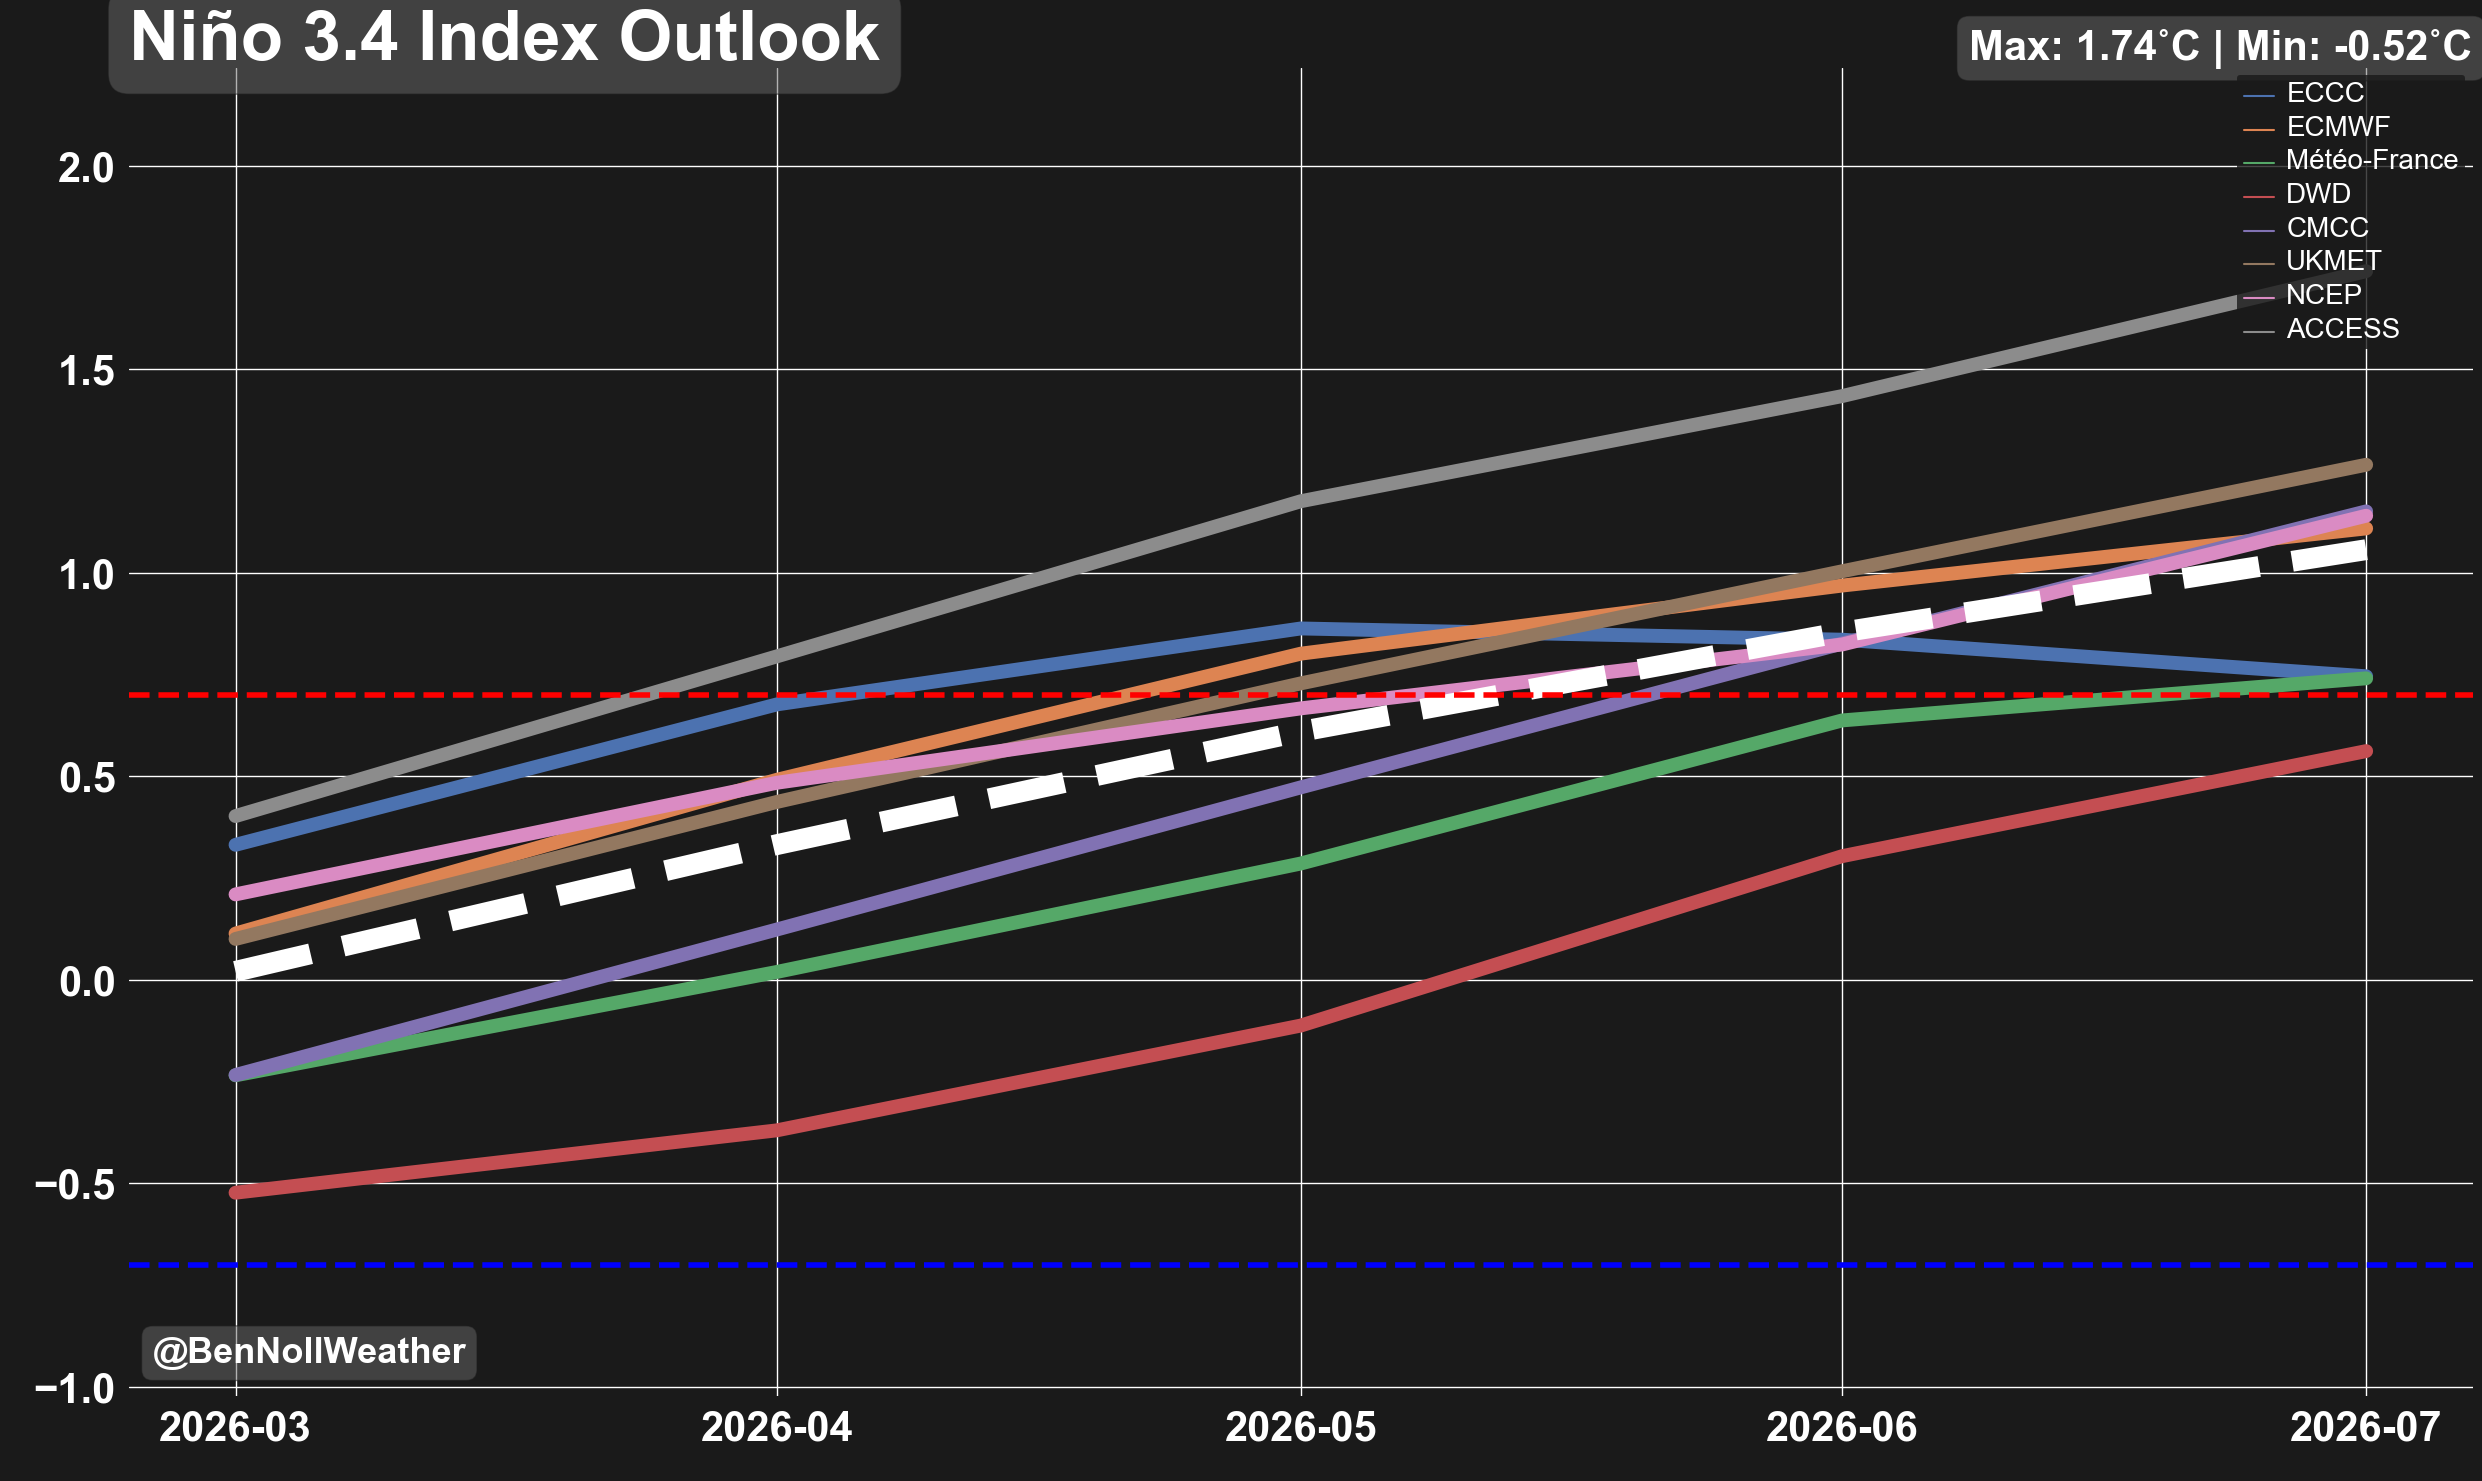
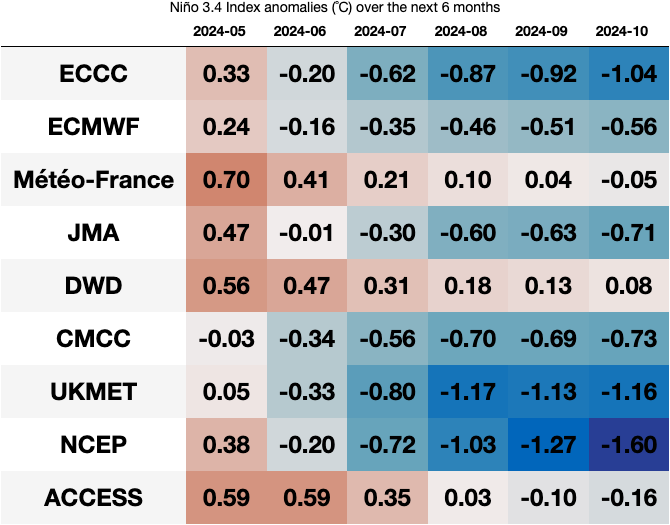
These maps are generated using data from the North American Multi-Model Ensemble (NMME) and update once a month around the 7th.


